Note
Click here to download the full example code
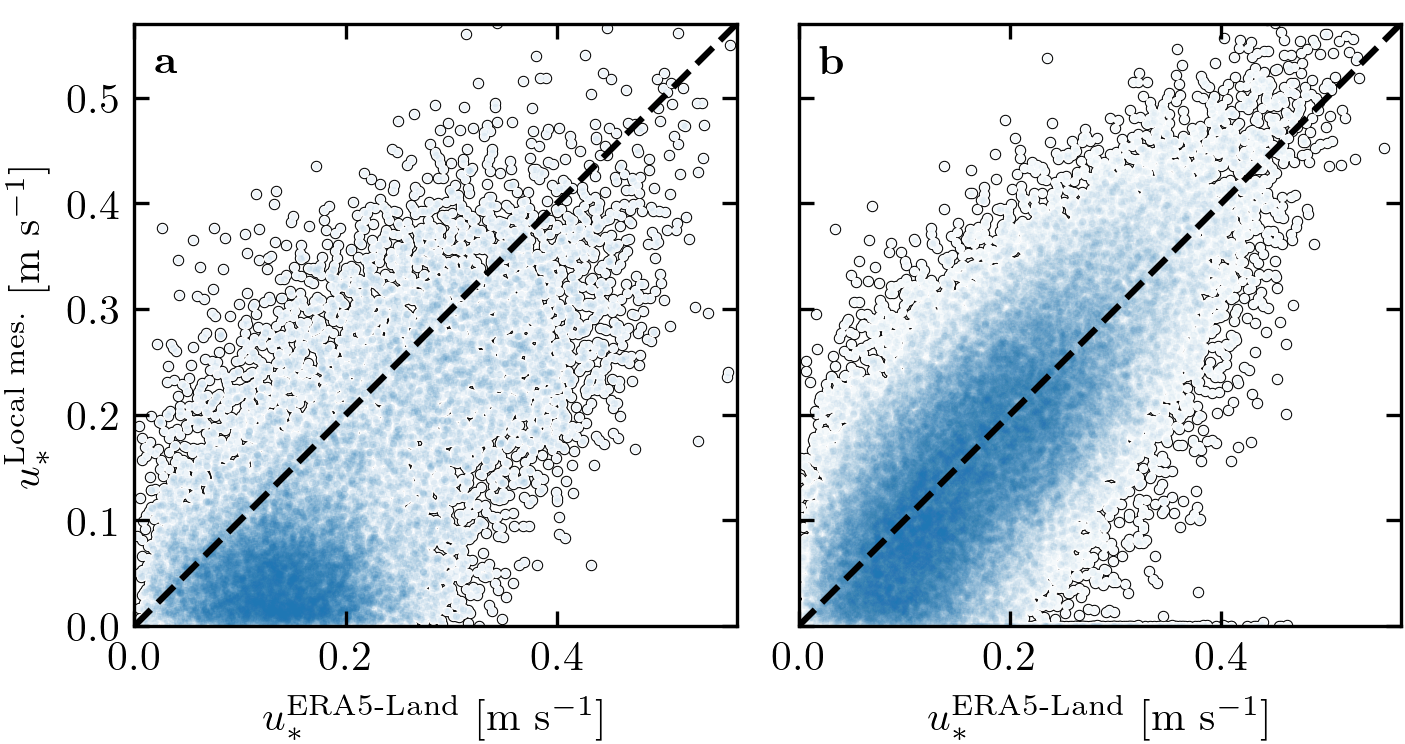
Figure 7 – Online Resource#
import os
import sys
import numpy as np
import matplotlib.pyplot as plt
import matplotlib.transforms as mtransforms
sys.path.append('../../')
import python_codes.theme as theme
from python_codes.plot_functions import plot_scatter_surrounded

theme.load_style()

# paths
path_savefig = '../../Paper/Figures'
path_outputdata = '../../static/data/processed_data/'

# Loading data
Data = np.load(os.path.join(path_outputdata, 'Data_final.npy'), allow_pickle=True).item()

labels = [r'\textbf{a}', r'\textbf{b}']

# preparing data
Stations = ['South_Namib_Station', 'Deep_Sea_Station']

Nocturnal_wind = {'South_Namib_Station': [150, 260], 'Deep_Sea_Station': [150, 230]}

# variables
x1 = np.concatenate([Data[station]['U_star_era'][(Data[station]['Orientation_era'] > Nocturnal_wind[station][0]) & (Data[station]['Orientation_era'] < Nocturnal_wind[station][1])]
                     for station in Stations])
y1 = np.concatenate([Data[station]['U_star_insitu'][(Data[station]['Orientation_era'] > Nocturnal_wind[station][0]) & (Data[station]['Orientation_era'] < Nocturnal_wind[station][1])]
                     for station in Stations])
t1 = np.concatenate([Data[station]['time'][(Data[station]['Orientation_era'] > Nocturnal_wind[station][0]) & (Data[station]['Orientation_era'] < Nocturnal_wind[station][1])]
                     for station in Stations])

hours = [i.hour for i in t1]
#
x2 = np.concatenate([Data[station]['U_star_era'][~((Data[station]['Orientation_era'] > Nocturnal_wind[station][0]) & (Data[station]['Orientation_era'] < Nocturnal_wind[station][1]))]
                     for station in Stations])
y2 = np.concatenate([Data[station]['U_star_insitu'][~((Data[station]['Orientation_era'] > Nocturnal_wind[station][0]) & (Data[station]['Orientation_era'] < Nocturnal_wind[station][1]))]
                     for station in Stations])

X = [x1, x2]
Y = [y1, y2]

# #### Figure
pad_angle = 2
labels = [r'\textbf{a}', r'\textbf{b}']
alphas = [0.075, 0.045]

fig, axarr = plt.subplots(1, 2, figsize=(theme.fig_width, 0.53*theme.fig_width),
                          constrained_layout=True, sharey=True)

for i, (ax, x, y, alpha) in enumerate(zip(axarr, X, Y, alphas)):
    plt.sca(ax)
    plot_scatter_surrounded(x, y, color='tab:blue', alpha=alpha)
    ax.plot([0, 0.6], [0, 0.6], 'k--')
    ax.set_xlabel(r'$u_{*}^{\textup{ERA5-Land}}~[\textup{m}~\textup{s}^{-1}]$')
    ax.set_xlim(0, 0.57)
    ax.set_ylim(0, 0.57)
    ax.set_aspect('equal')

axarr[0].set_ylabel(r'$u_{*}^{\textup{Local mes.}}~[\textup{m}~\textup{s}^{-1}]$')

trans = mtransforms.ScaledTranslation(5/72, -5/72, fig.dpi_scale_trans)
for label, ax in zip(labels, axarr.flatten()):
    ax.text(0.0, 1.0, label, transform=ax.transAxes + trans, va='top')

plt.savefig(os.path.join(path_savefig, 'Figure7_supp.pdf'), dpi=400)
plt.show()
Total running time of the script: ( 0 minutes 2.170 seconds)