Note
Click here to download the full example code
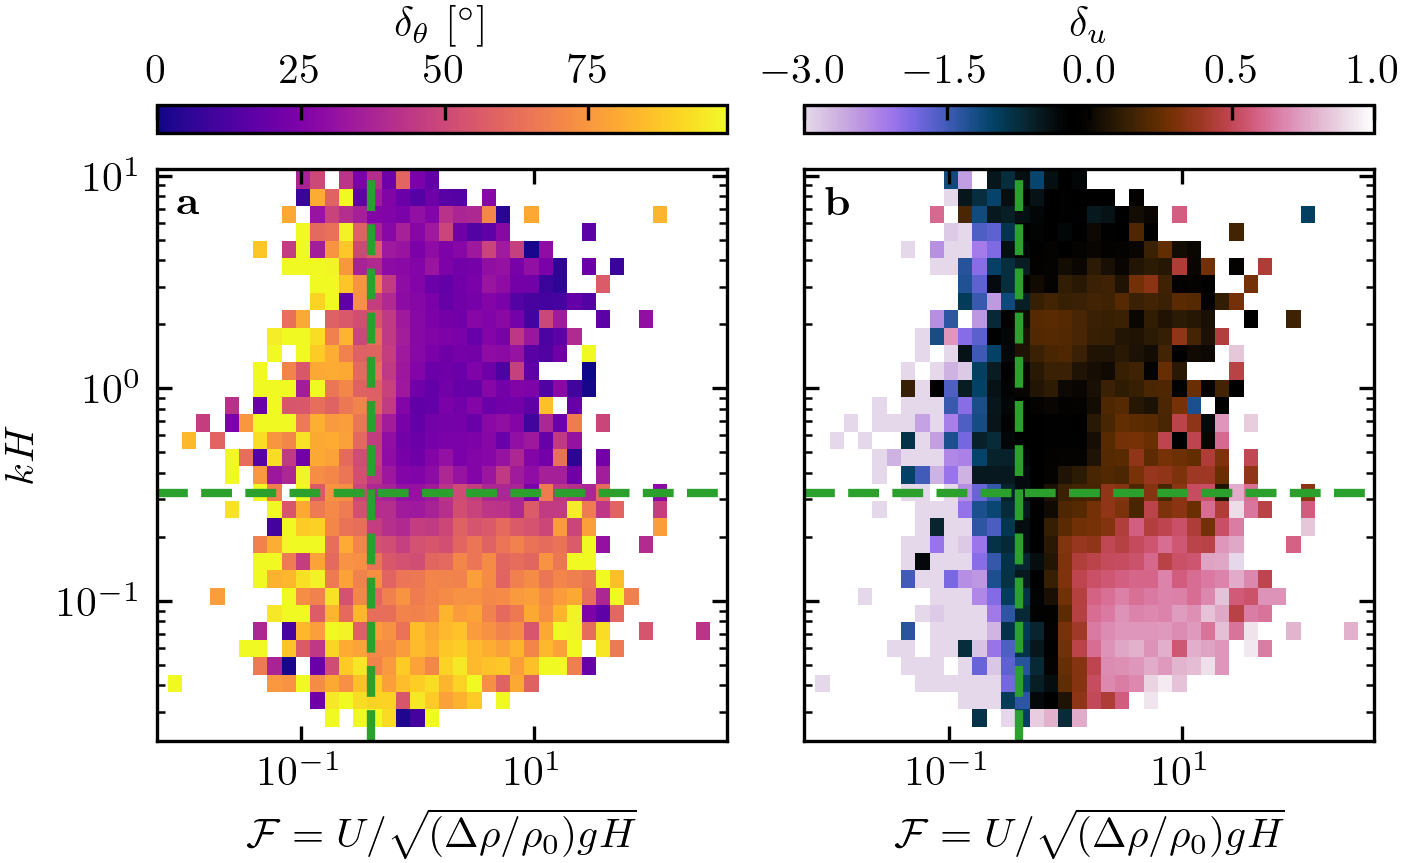
Figure 9#
import os
import sys
import numpy as np
import matplotlib.pyplot as plt
import matplotlib.colors as mpcolors
import matplotlib.transforms as mtransforms
sys.path.append('../')
import python_codes.theme as theme
from python_codes.general import smallestSignedAngleBetween, find_mode_distribution
from python_codes.plot_functions import plot_regime_diagram

# Loading figure theme
theme.load_style()

# paths
path_imgs = '../static/images/'
path_savefig = '../Paper/Figures'
path_outputdata = '../static/data/processed_data'

# ##### Loading meteo data
Data = np.load(os.path.join(path_outputdata, 'Data_final.npy'), allow_pickle=True).item()
Stations = ['South_Namib_Station', 'Deep_Sea_Station']

# #### Computing quantities

Orientation_era = np.concatenate([Data[station]['Orientation_era'] for station in Stations])
Orientation_insitu = np.concatenate([Data[station]['Orientation_insitu'] for station in Stations])
U_era = np.concatenate([Data[station]['U_star_era'] for station in Stations])
U_insitu = np.concatenate([Data[station]['U_star_insitu'] for station in Stations])
numbers = {key: np.concatenate([Data[station][key] for station in Stations]) for key in ('Froude', 'kH', 'kLB')}
#
Delta = smallestSignedAngleBetween(Orientation_era, Orientation_insitu)
mode_delta = np.array([find_mode_distribution(Delta, i) for i in np.arange(150, 350)]).mean()
delta_angle = np.abs(Delta)
delta_u = (U_era - U_insitu)/U_era

# #### Figure parameters
lims = {'Froude': (5.8e-3, 450), 'kLB': (0.009, 7.5), 'kH': (2.2e-2, 10.8)}
cmaps = [theme.cmap_delta_theta, theme.cmap_delta_u]
norms = [mpcolors.Normalize(vmin=0, vmax=99),
         mpcolors.TwoSlopeNorm(vmin=-3, vcenter=0, vmax=1)]
# mpcolors.TwoSlopeNorm(vmin=-1, vcenter=0, vmax=100)]
cbar_labels = [r'$\delta_{\theta}~[^\circ]$', r'$\delta_{u}$']
quantities = [delta_angle, delta_u]
labels = [r'\textbf{a}', r'\textbf{b}']
cbticks = [[0, 25, 50, 75], [-3, -1.5, 0, 0.5, 1]]

mask = ~np.isnan(numbers['Froude'])
log_counts_max = np.log10(2230)

var1, var2 = 'Froude', 'kH'
xlabel = r'$\mathcal{F} =  U/\sqrt{(\Delta\rho/\rho_{0}) g H}$'

# #### Figure
fig, axarr = plt.subplots(1, 2, figsize=(theme.fig_width, 0.375*theme.fig_height_max),
                          constrained_layout=True)

for i, (ax, quantity, cmap, norm, cbtick) in enumerate(zip(axarr.flatten(),
                                                           quantities, cmaps, norms,
                                                           cbticks)):
    ylabel = '$k H$' if i == 0 else None
    #
    vars = [numbers[var1][mask], numbers[var2][mask]]
    lims_list = [lims[var1], lims[var2]]
    #
    bin1 = np.logspace(np.floor(np.log10(numbers[var1][mask].min())), np.ceil(np.log10(numbers[var1][mask].max())), 50)
    bin2 = np.logspace(np.floor(np.log10(numbers[var2][mask].min())), np.ceil(np.log10(numbers[var2][mask].max())), 50)
    bins = [bin1, bin2]
    a = plot_regime_diagram(ax, quantity[mask], vars, lims_list, xlabel, ylabel, bins=bins, norm=norm, cmap=cmap, type='binned')
    #
    # regime lines
    ax.axvline(0.4, color=theme.regime_line_color, linestyle='--', lw=2)
    ax.axhline(0.32, color=theme.regime_line_color, linestyle='--', lw=2)
    #
    # colorbar
    sm = plt.cm.ScalarMappable(cmap=cmap, norm=norm)
    cb = plt.colorbar(sm, ax=ax, location='top', ticks=cbtick)
    cb.set_label(cbar_labels[i])

trans = mtransforms.ScaledTranslation(5/72, -4/72, fig.dpi_scale_trans)
for label, ax in zip(labels, axarr.flatten()):
    ax.text(0.0, 1.0, label, transform=ax.transAxes + trans, va='top')

fig.align_labels()
plt.savefig(os.path.join(path_savefig, 'Figure8.pdf'))
plt.show()
Total running time of the script: ( 0 minutes 1.835 seconds)