Note
Click here to download the full example code
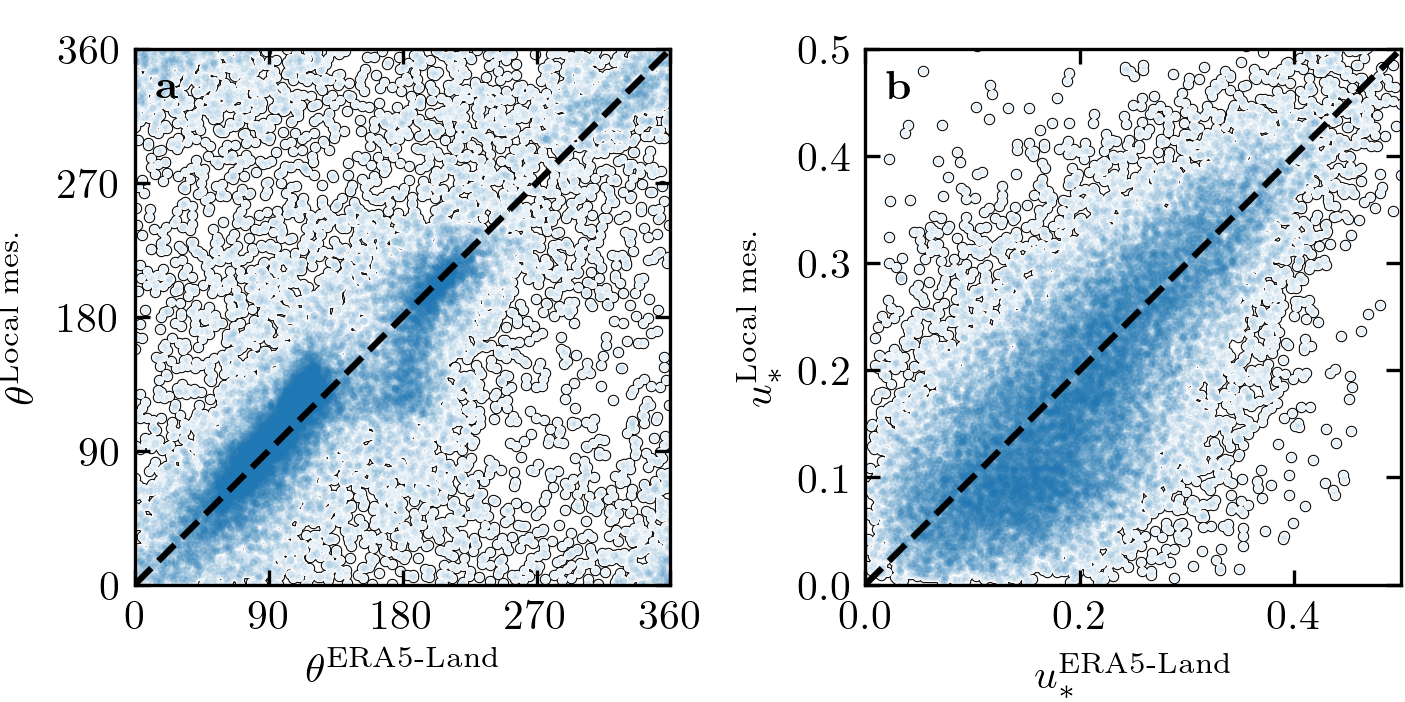
Figure 5 – Online Resource#
import os
import sys
import numpy as np
import matplotlib.pyplot as plt
import matplotlib.transforms as mtransforms
sys.path.append('../../')
import python_codes.theme as theme
from python_codes.plot_functions import plot_scatter_surrounded


theme.load_style()

# paths
path_savefig = '../../Paper/Figures'
path_outputdata = '../../static/data/processed_data/'

Data = np.load(os.path.join(path_outputdata, 'Data_final.npy'), allow_pickle=True).item()
labels = [r'\textbf{a}', r'\textbf{b}']

# preparing data
Stations_ref = ['Adamax_Station', 'Huab_Station']
#
Theta_ERA = np.concatenate([Data[station]['Orientation_era'] for station in Stations_ref])
Theta_Station = np.concatenate([Data[station]['Orientation_insitu'] for station in Stations_ref])
#
U_ERA = np.concatenate([Data[station]['U_star_era'] for station in Stations_ref])
U_Station = np.concatenate([Data[station]['U_star_insitu'] for station in Stations_ref])


# #### Figure

fig, axrr = plt.subplots(1, 2, figsize=(theme.fig_width, 0.5*theme.fig_width),
                         constrained_layout=True)

for ax, quantity in zip(axrr, [[Theta_ERA, Theta_Station], [U_ERA, U_Station]]):
    plt.sca(ax)
    plot_scatter_surrounded(quantity[0], quantity[1], color='tab:blue', alpha=0.1)
    ax.plot([0, 360], [0, 360], 'k--')

axrr[0].set_xlim(0, 360)
axrr[0].set_ylim(0, 360)
axrr[0].set_xticks([0, 90, 180, 270, 360])
axrr[0].set_yticks([0, 90, 180, 270, 360])
axrr[0].set_xlabel(r'$\theta^{\textup{ERA5-Land}}$')
axrr[0].set_ylabel(r'$\theta^{\textup{Local mes.}}$')
axrr[0].set_aspect('equal')
#
axrr[1].set_xlim(0, 0.5)
axrr[1].set_ylim(0, 0.5)
axrr[1].set_xlabel(r'$u_{*}^{\textup{ERA5-Land}}$')
axrr[1].set_ylabel(r'$u_{*}^{\textup{Local mes.}}$')
axrr[1].set_aspect('equal')
#

trans = mtransforms.ScaledTranslation(5/72, -5/72, fig.dpi_scale_trans)
for label, ax in zip(labels, axrr.flatten()):
    ax.text(0.0, 1.0, label, transform=ax.transAxes + trans, va='top')

plt.savefig(os.path.join(path_savefig, 'Figure5_supp.pdf'), dpi=400)
plt.show()
Total running time of the script: ( 0 minutes 1.877 seconds)