python_codes.plot_functions.plot_scatter_surrounded#
- plot_scatter_surrounded(x, y, color, alpha)[source]#
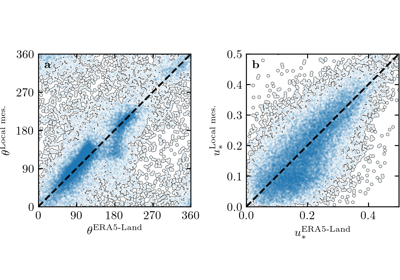
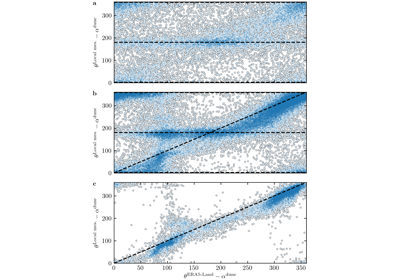
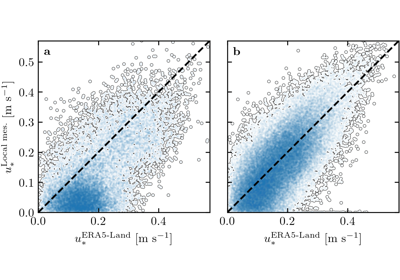
Plot a scatter plot with a black thin line surrounding point clusters.
- Parameters
x (array_like) – x vector.
y (array_like) – x vector, same shape as y.
color (str or array_like) – color passed to c argument of
matplotlib.pyplot.scatter.alpha (float) – alpha passed to
matplotlib.pyplot.scatter.
- Returns
Nothing, it just updates the plot.
- Return type
None


