python_codes.plot_functions.make_nice_histogram#
- make_nice_histogram(data, nbins, ax, vmin=None, vmax=None, scale_bins='lin', density=True, orientation='vertical', **kwargs)[source]#
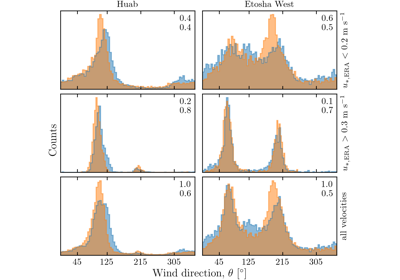
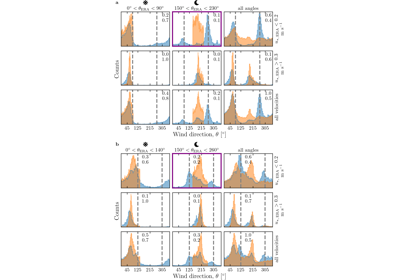
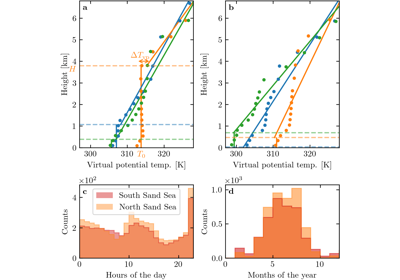
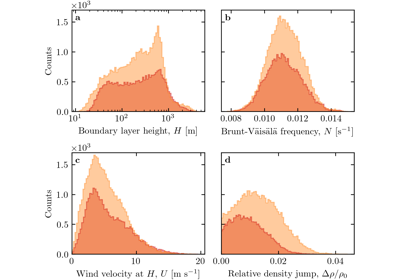
Function making a fancy histogram from input data.
- Parameters
data (numpy array, dimensions (N,)) – One dimensional input data array
nbins (int) – Number of bins
ax (matplotlib.axes) – Figure ax on which to plot the data.
vmin (float) – Minimum value of the histogram (the default is None).
vmax (float) – Maximum value of the histogram (the default is None).
scale_bins (str) – If ‘lin’, the nbins are taken linearly, while if ‘log’, the bins are logarithmically spaced (the default is ‘lin’).
density (bool) – If True, the histogram is normalized such that its integral is unity (the default is True).
orientation (str) – If vertical, the histogram bars are vertical and the variable is on thr horizontal axis. If ‘horizontal’, its the other way around (the default is ‘vertical’).
**kwargs – Optional parameters passed to
matplotlib.pyplot.hist.
- Returns
Description of returned object.
- Return type
