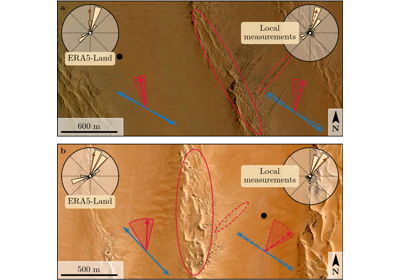
python_codes.plot_functions.plot_flux_rose#
- plot_flux_rose(angles, distribution, ax, fig, nbins=20, withaxe=0, label=None, boxprops=None, boxloc=(0.5, 0.05), **kwargs)[source]#
Short summary.
- Parameters
angles (array_like) – bin center in orientation of the flux distribution.
distributions (array_like) – angular flux distribution.
ax (matplotlib.axes) – ax of the figure on which the wind rose is plotted.
fig (matplotlib.figure) – figure on which the wind rose is plotted.
nbins (int) – number of angular bins for the plot (the default is 20).
withaxe (0 or 1) – Define if the polar axes are plotted or not (the default is 0).
label (str) – If not None, sets a label at the bottom of the flux rose (the default is None).
boxprops (dict) – Text box properties (the default is None).
boxloc (list, tuple) – Text location (x,y), in ax coordinates (the default is (0.5, 0.05)).
**kwargs – Optional parameters passed to
windrose.WindroseAxes.bar.
- Returns
return the axe on which the wind rose is plotted. Can be used for further modifications.
- Return type
WindroseAxes
