Note
Click here to download the full example code
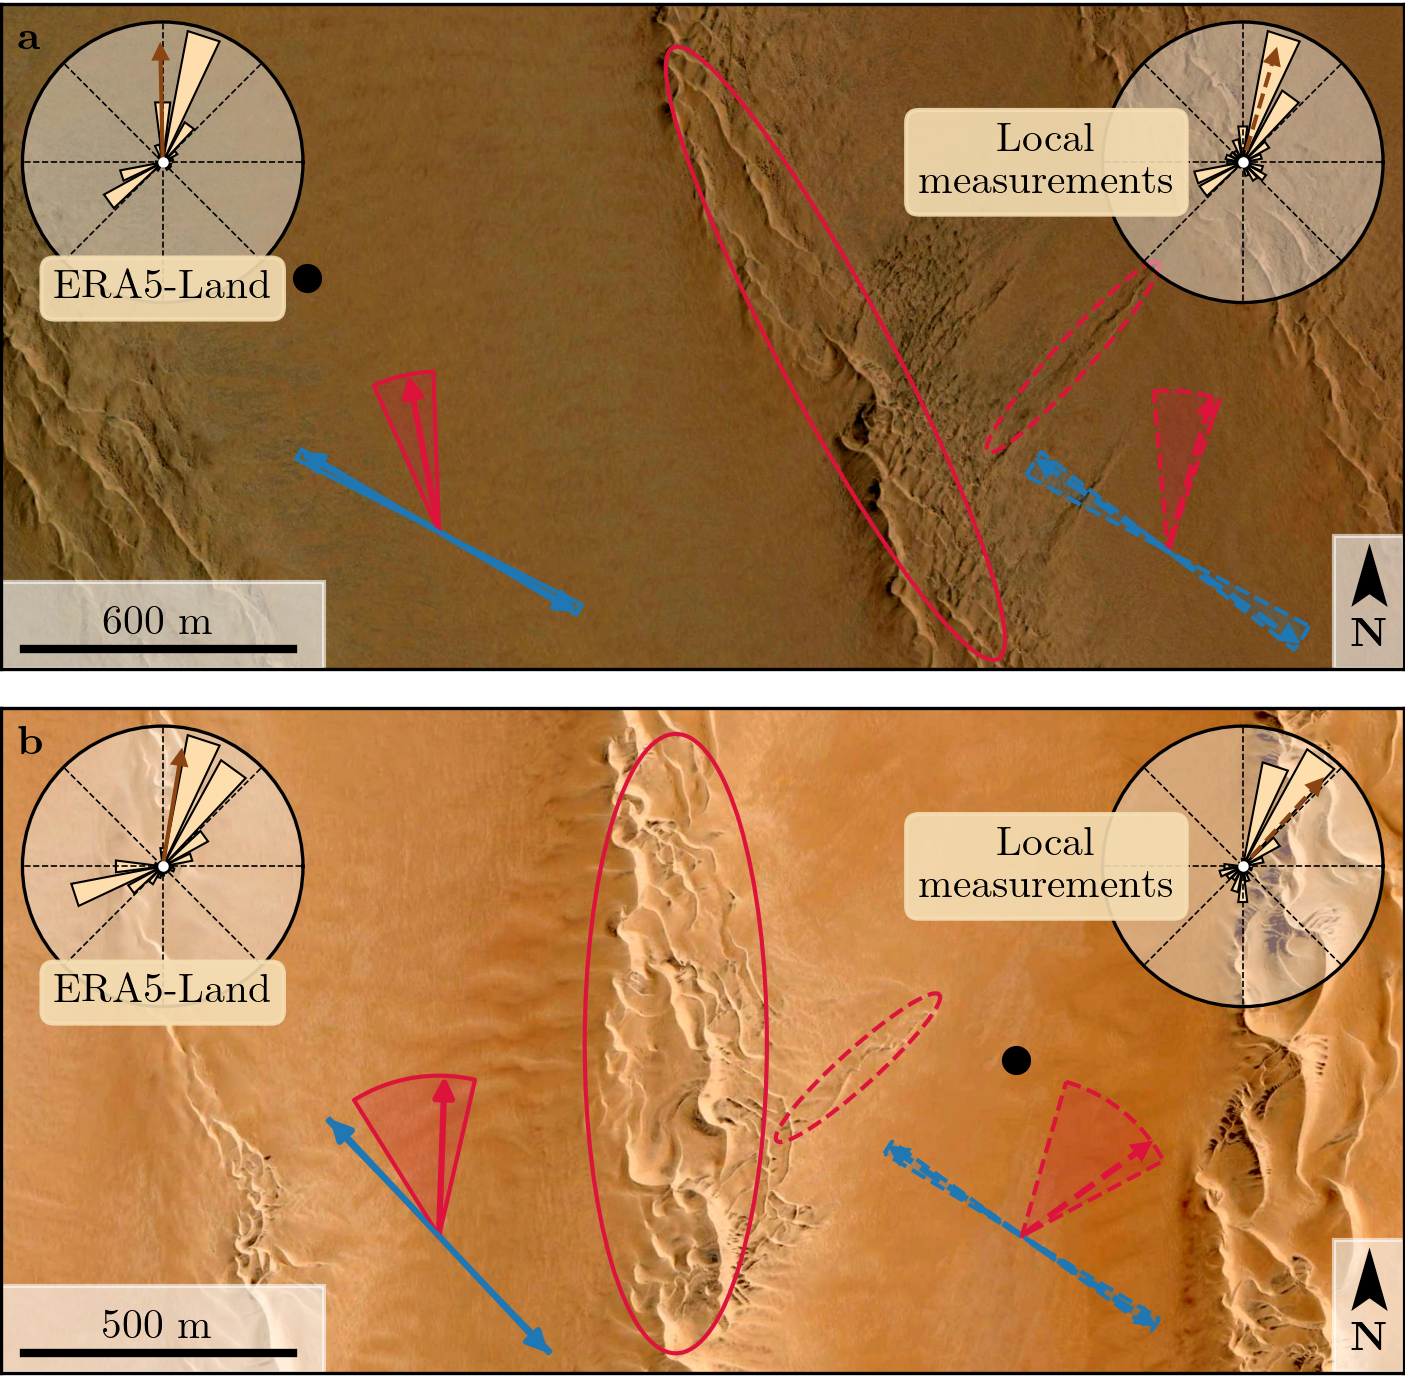
Figure 8#
import os
import sys
import numpy as np
from PIL import Image
from datetime import datetime
import matplotlib.pyplot as plt
import matplotlib.patches as ptch
from matplotlib.colors import to_rgba
import matplotlib.transforms as mtransforms
sys.path.append('../')
import python_codes.theme as theme
from python_codes.meteo_analysis import quartic_transport_law, quadratic_transport_law
from python_codes.general import Make_angular_PDF, cosd, sind, Vector_average
from python_codes.CourrechDuPont2014 import Bed_Instability_Orientation, Elongation_direction
from python_codes.plot_functions import plot_flux_rose, plot_arrow


def North_arrow(fig, ax, center, length, length_small, width, radius, theta=0, color='k'):
    y_start = radius + length - length_small
    arrow = np.array([[0, -y_start], [width/2, -radius],
                      [0, -(radius + length)], [-width/2, -radius], [0, -y_start]])
    arrow = arrow + np.array(center)
    ax.add_patch(plt.Polygon(arrow, color=color))
    t = ax.text(center[0], center[1], 'N')
    r = fig.canvas.get_renderer()
    inv = ax.transData.inverted()
    bb = t.get_window_extent(renderer=r).transformed(inv)
    t.set_visible(False)
    height_t = bb.height
    t = ax.text(center[0], center[1] - height_t/2, r'\textbf{N}', color=color, ha='center')


def plot_orientation_wedge(ax, A_F, A_BI, center, length, color_F, color_BI, alpha=0.2, **kwargs):
    wedge_f = ptch.Wedge(center, length, -np.nanmax(A_F), -np.nanmin(A_F),
                         edgecolor=color_F, facecolor=to_rgba(color_F, alpha), joinstyle='round', **kwargs)
    wedge_bi = ptch.Wedge(center, length, -np.nanmax(A_BI), -np.nanmin(A_BI),
                          edgecolor=color_BI, facecolor=to_rgba(color_BI, alpha), joinstyle='round', **kwargs)
    wedge_bis = ptch.Wedge(center, length, -np.nanmax(A_BI) + 180, -np.nanmin(A_BI) + 180,
                           edgecolor=color_BI, facecolor=to_rgba(color_BI, alpha), joinstyle='round', **kwargs)
    #
    ax.add_patch(wedge_f)
    ax.add_patch(wedge_bi)
    ax.add_patch(wedge_bis)


# Loading figure theme
theme.load_style()

# paths
path_imgs = '../static/images/'
path_savefig = '../Paper/Figures'
path_outputdata = '../static/data/processed_data'

# ##### Loading meteo data
Data = np.load(os.path.join(path_outputdata, 'Data_final.npy'), allow_pickle=True).item()
Stations = ['South_Namib_Station', 'Deep_Sea_Station']
images = {station: np.array(Image.open(os.path.join(path_imgs, station[:-8] + '_zoom.png'))) for station in Stations}
scales = {'South_Namib_Station': 600, 'Deep_Sea_Station': 500}

# ##### Calculation of sediment flux rose and dune orientations
rho_g = 2.65e3  # grain density
rho_f = 1   # fluid density
g = 9.81  # [m/s2]
grain_diameters = np.linspace(100e-6, 400e-6, 30)  # grain size [m]
Q = np.sqrt((rho_g - rho_f*g*grain_diameters)/rho_f)*grain_diameters  # characteristic flux [m2/s]
#
# Quadratic transport law parameters
theta_th_quadratic = 0.005  # threshold shield numbers for the quadratic
Omega = 8
# Quartic transport law parameters
theta_th_quartic = 0.0035    # threshold shield numbers for the quartic
#
gamma = np.array(list(np.logspace(-1, 1, 10)) + [1.6])
alpha_BI, alpha_F, PDF = [{} for i in range(3)]
#
# time masks for computing flux roses and dune orientation
time_mask = {'Deep_Sea_Station': [Data['Deep_Sea_Station']['time'].min(), Data['Deep_Sea_Station']['time'].max()],
             # 'South_Namib_Station': [Data['South_Namib_Station']['time'].min(), Data['South_Namib_Station']['time'].max()],
             'South_Namib_Station': [datetime(2014, 7, 1), Data['South_Namib_Station']['time'].max()],
             }

for station in Stations:
    # time masks
    mask_time = (Data[station]['time'] >= time_mask[station][0]) & (Data[station]['time'] <= time_mask[station][1])
    # Vector of orientations and shear velocity
    Orientations = np.array([Data[station]['Orientation_insitu'][mask_time], Data[station]['Orientation_era'][mask_time]])
    Shear_vel = np.array([Data[station]['U_star_insitu'][mask_time], Data[station]['U_star_era'][mask_time]])
    # corresponding shield number
    theta = (rho_f/((rho_g - rho_f)*g*grain_diameters[:, None, None]))*Shear_vel[None, :, :]**2
    # sediment fluxes
    q = np.array([quadratic_transport_law(theta, theta_th_quadratic, Omega),
                  quartic_transport_law(theta, theta_th_quartic)])
    # Angular distributions of sediment fluxes
    PDF[station], Angles = Make_angular_PDF(Orientations[None, None, :, :]*np.ones(q.shape), q)
    # Dune orientations
    alpha_BI[station] = Bed_Instability_Orientation(Angles[None, None, None, None, :], PDF[station][None, :, :, :, :], gamma=gamma[:, None, None, None, None])
    alpha_F[station] = Elongation_direction(Angles[None, None, None, None, :], PDF[station][None, :, :, :, :], gamma=gamma[:, None, None, None, None])

# ### figure properties
color_BI = 'tab:blue'
color_F = 'crimson'
lw_arrow = 1.5
props = dict(boxstyle='round', color='wheat', alpha=0.9)
labels = [r'\textbf{a}', r'\textbf{b}']

# #### Figure
fig, axarr = plt.subplots(2, 1, figsize=(theme.fig_width, 0.98*theme.fig_width))
plt.subplots_adjust(bottom=0.001, top=0.999, left=0.001, right=0.999, hspace=0.05)

for ax, station in zip(axarr.flatten(), Stations):
    ax.imshow(images[station][:912, :])
    ax.set_xticks([])
    ax.set_yticks([])
    #
    # ## scale bar
    backgrnd = plt.Rectangle((0, 0), width=0.23, height=0.13, transform=ax.transAxes, color='w', alpha=0.6)
    ax.add_patch(backgrnd)
    ax.plot([30, 30 + 370], [885, 885], linewidth=2, color='k')
    ax.text(30 + 370/2, 875, str(scales[station]) + '~m', color='k', ha='center', va='bottom')
    #
    # ## north arrow
    length = 70
    length_small = 0.8*length
    width = 40
    radius = 35
    center = np.array([1877, 855])
    #
    backgrnd = plt.Rectangle((0.95, 0), width=0.05, height=0.2, transform=ax.transAxes, color='w', alpha=0.6)
    ax.add_patch(backgrnd)
    North_arrow(fig, ax, center, length, length_small, width, radius, theta=0, color='k')
    #
    # #### Plot flux roses
    size_rose_x = 0.2
    index = 8
    bbox = ax.get_window_extent().transformed(fig.dpi_scale_trans.inverted())
    pad_bord_x = 0.015
    ax_aspect = bbox.width / bbox.height
    # Era5land
    anchor = [pad_bord_x, 1-(pad_bord_x+size_rose_x)*ax_aspect, size_rose_x, size_rose_x*ax_aspect]
    RDD, RDP = Vector_average(Angles, PDF[station][0, index, 1, :])
    subax = ax.inset_axes(bounds=anchor, transform=ax.transAxes)
    a = plot_flux_rose(Angles, PDF[station][0, index, 1, :], subax, fig, cmap=theme.flux_color,
                       edgecolor='k', linewidth=0.5, label='ERA5-Land', boxprops=props)
    plot_arrow(a, (RDD*np.pi/180, 0), (RDD*np.pi/180, 0.85*a.get_rmax()),
               arrowprops=dict(arrowstyle="<|-", shrinkA=0, shrinkB=0, color='saddlebrown', mutation_scale=10))
    a.grid(linewidth=0.4, color='k', linestyle='--')
    a.set_axisbelow(True)
    a.patch.set_alpha(0.4)
    a.set_xticklabels([])
    #
    # in situ
    anchor = [1-pad_bord_x-size_rose_x, 1-(pad_bord_x+size_rose_x)*ax_aspect, size_rose_x, size_rose_x*ax_aspect]
    RDD, RDP = Vector_average(Angles, PDF[station][0, index, 0, :])
    subax = ax.inset_axes(bounds=anchor, transform=ax.transAxes)
    a = plot_flux_rose(Angles, PDF[station][0, index, 0, :], subax, fig, cmap=theme.flux_color,
                       edgecolor='k', linewidth=0.5, label='Local \n measurements',
                       boxprops=props, boxloc=(-0.2, 0.5))
    plot_arrow(a, (RDD*np.pi/180, 0), (RDD*np.pi/180, 0.85*a.get_rmax()),
               arrowprops=dict(arrowstyle="<|-", shrinkA=0, shrinkB=0, color='saddlebrown',
               mutation_scale=10, ls='--'))
    a.grid(linewidth=0.4, color='k', linestyle='--')
    a.set_axisbelow(True)
    a.patch.set_alpha(0.4)
    a.set_xticklabels([])
    #
    # #### Plot orientation arrows
    length = 220
    # ## Era5 Land
    center = np.array([600, 724])
    #
    vec = np.array([cosd(alpha_BI[station][-1, 1, index, 1]), sind(-alpha_BI[station][-1, 1, index, 1])])
    start = center - length*vec
    end = center + length*vec
    plot_arrow(ax, start, end, arrowprops=dict(arrowstyle="<|-|>", color=color_BI, shrinkA=0, shrinkB=0,
                                               lw=lw_arrow, mutation_scale=10, linestyle='-'))
    #
    vec = np.array([cosd(alpha_F[station][-1, 1, index, 1]), sind(-alpha_F[station][-1, 1, index, 1])])
    start = center
    end = start + length*vec
    plot_arrow(ax, start, end, arrowprops=dict(arrowstyle="<|-", color=color_F, shrinkA=0, shrinkB=0,
                                               lw=lw_arrow, mutation_scale=10, linestyle='-'))
    #
    plot_orientation_wedge(ax, alpha_F[station][:, :, :, 1], alpha_BI[station][:, :, :, 1],
                           center, length, color_F, color_BI, alpha=0.2)
    # ## station
    if station == 'Deep_Sea_Station':
        center = np.array([1400, 724])
    else:
        center = np.array([1600, 750])
    vec = np.array([cosd(alpha_BI[station][-1, 1, index, 0]), sind(-alpha_BI[station][-1, 1, index, 0])])
    start = center - length*vec
    end = center + length*vec
    plot_arrow(ax, start, end, arrowprops=dict(arrowstyle="<|-|>", color=color_BI, shrinkA=0, shrinkB=0,
                                               lw=lw_arrow, mutation_scale=10, linestyle='--'))
    #
    vec = np.array([cosd(alpha_F[station][-1, 1, index, 0]), sind(-alpha_F[station][-1, 1, index, 0])])
    start = center
    end = start + length*vec
    plot_arrow(ax, start, end, arrowprops=dict(arrowstyle="<|-", color=color_F, shrinkA=0, shrinkB=0,
                                               lw=lw_arrow, mutation_scale=10, linestyle='--'))
    #
    plot_orientation_wedge(ax, alpha_F[station][:, :, :, 0], alpha_BI[station][:, :, :, 0],
                           center, length, color_F, color_BI, alpha=0.2, linestyle='--')

# #### Other annotations
# station positions
axarr[0].scatter(419, 376, color=theme.color_station_position)
axarr[1].scatter(1392, 483, color=theme.color_station_position)
#
# Observed dune patterns
ellispe_big = ptch.Ellipse((925, 460), 250, 850, angle=0, color=color_F, fill=False)
ellispe_small = ptch.Ellipse((1175, 493), 50, 300, angle=48, color=color_F, fill=False, ls='--')
axarr[1].add_artist(ellispe_big)
axarr[1].add_artist(ellispe_small)
#
ellispe_big = ptch.Ellipse((1144, 479), 150, 950, angle=-28, color=color_F, fill=False)
ellispe_small = ptch.Ellipse((1470, 484), 50, 350, angle=42, color=color_F, fill=False, ls='--')
axarr[0].add_artist(ellispe_big)
axarr[0].add_artist(ellispe_small)


trans = mtransforms.ScaledTranslation(4/72, -4/72, fig.dpi_scale_trans)
for label, ax in zip(labels, axarr.flatten()):
    ax.text(0.0, 1.0, label, transform=ax.transAxes + trans, va='top')

fig.align_labels()
plt.savefig(os.path.join(path_savefig, 'Figure9.pdf'), dpi=400)
plt.show()
Total running time of the script: ( 0 minutes 13.579 seconds)