Note
Click here to download the full example code
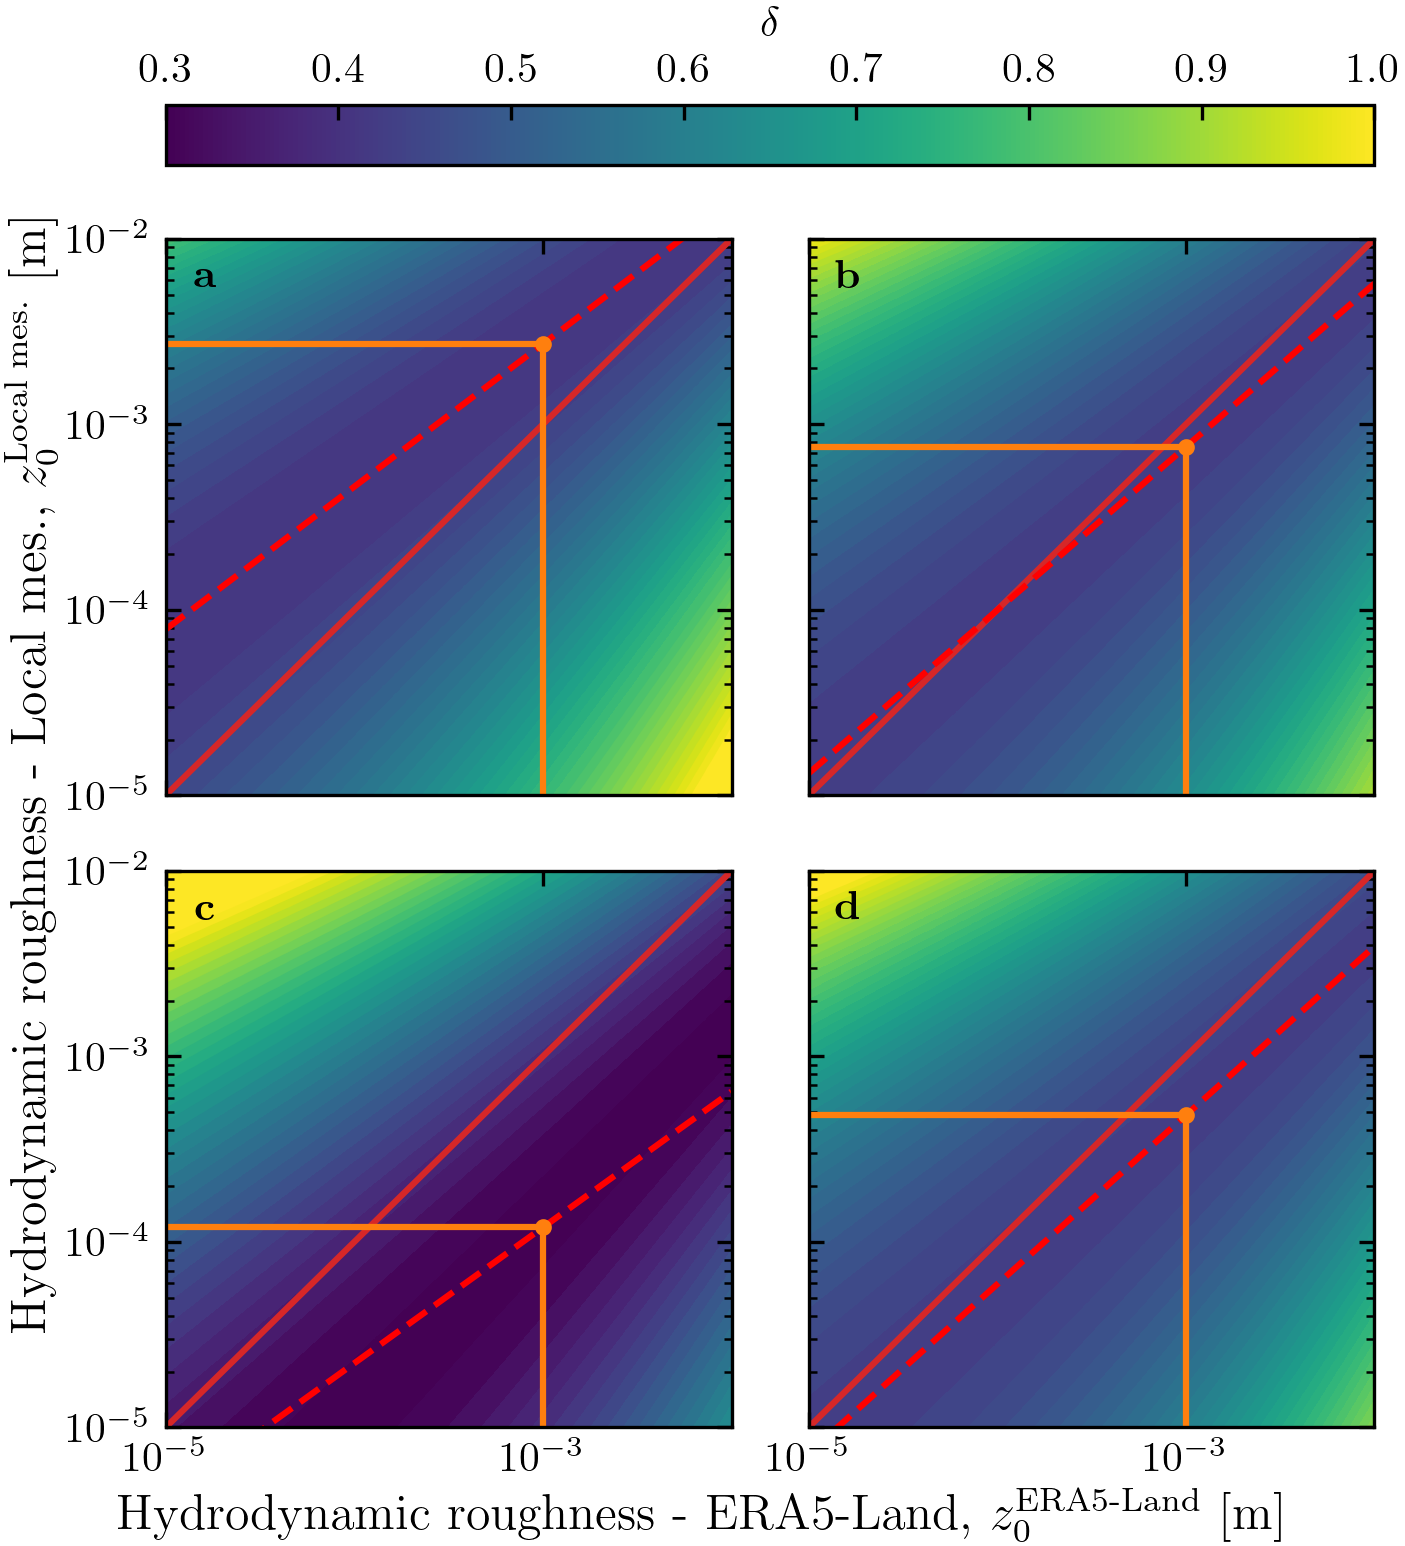
Figure 3 – Online Resource#
import os
import sys
import numpy as np
import matplotlib.pyplot as plt
from matplotlib.colors import Normalize
sys.path.append('../../')
import python_codes.theme as theme

theme.load_style()

# paths
path_savefig = '../../Paper/Figures'
path_outputdata = '../../static/data/processed_data/'

Data = np.load(os.path.join(path_outputdata, 'Data_final.npy'), allow_pickle=True).item()
Data_roughness = np.load(os.path.join(path_outputdata, 'Data_calib_roughness.npy'),
                         allow_pickle=True).item()

labels = [r'\textbf{a}', r'\textbf{b}', r'\textbf{c}', r'\textbf{d}']
norm = Normalize(vmin=0.3, vmax=1, clip=True)

# #### Figure
fig, axrr = plt.subplots(2, 2, figsize=(theme.fig_width, 1.1*theme.fig_width),
                         sharex=True, sharey=True, constrained_layout=True)
#
for i, (ax, p, metric, station, label) in enumerate(zip(axrr.flatten(), Data_roughness['Pvals'],
                                                        Data_roughness['Metrics'], Data_roughness['Stations'], labels)):
    cs = ax.contourf(Data_roughness['z0_era_vals'], Data_roughness['z0_insitu_vals'], metric, levels=50, norm=norm)
    for c in cs.collections:
        c.set_edgecolor("face")
    ax.plot(Data_roughness['z0_era_vals'], Data_roughness['z0_insitu_vals'], color='tab:red', label='$y=x$')
    ax.plot(Data_roughness['z0_era_vals'], np.exp(p[1])*Data_roughness['z0_era_vals']**p[0], 'r--', label='minimum line')
    a, = ax.plot([Data_roughness['z0_era_vals'].min(), 1e-3], [Data[station]['z0_insitu'], Data[station]['z0_insitu']], color='tab:orange')
    ax.plot([1e-3, 1e-3], [Data_roughness['z0_insitu_vals'].min(), Data[station]['z0_insitu']], color=a.get_color())
    ax.plot(1e-3, Data[station]['z0_insitu'], '.', color=a.get_color())
    #
    ax.text(0.07, 0.93, label, ha='center', va='center', transform=ax.transAxes)


plt.xlim([Data_roughness['z0_era_vals'].min(), Data_roughness['z0_era_vals'].max()])
plt.ylim([Data_roughness['z0_insitu_vals'].min(), Data_roughness['z0_insitu_vals'].max()])
plt.gca().set_xscale('log')
plt.gca().set_yscale('log')
fig.supxlabel(r'Hydrodynamic roughness - ERA5-Land, $z_{0}^{\textup{ERA5-Land}}$ [m]')
fig.supylabel(r'Hydrodynamic roughness - Local mes., $z_{0}^{\textup{Local mes.}}$ [m]')

# colorbar
sm = plt.cm.ScalarMappable(cmap='viridis', norm=norm)
plt.colorbar(sm, ax=axrr, location='top', label=r'$\delta$')

plt.savefig(os.path.join(path_savefig, 'Figure3_supp.pdf'))
plt.show()
Total running time of the script: ( 0 minutes 2.497 seconds)