Note
Click here to download the full example code
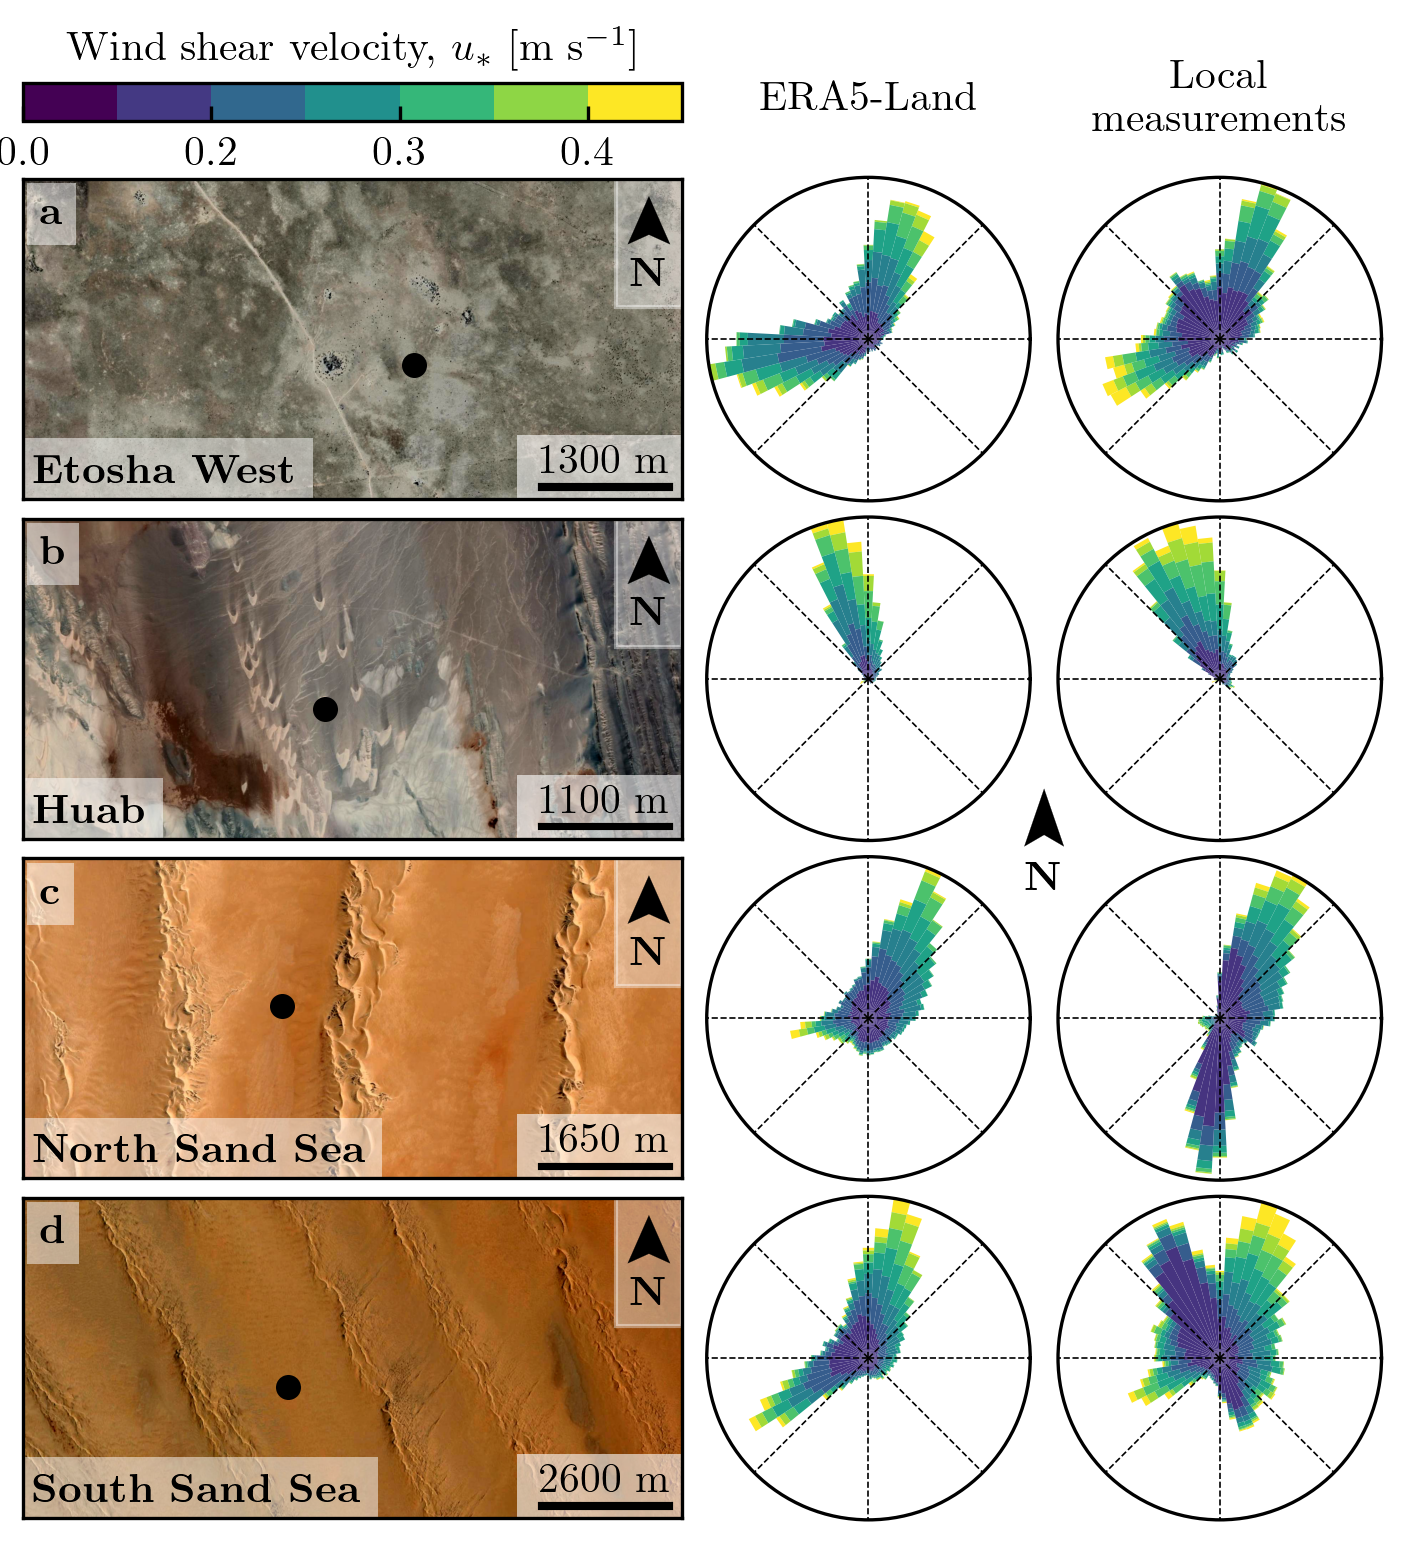
Figure 2#
import os
import sys
import numpy as np
from PIL import Image
import matplotlib.pyplot as plt
from matplotlib.patches import Rectangle
from matplotlib.colors import BoundaryNorm
import matplotlib.transforms as mtransforms
from mpl_toolkits.axes_grid1.anchored_artists import AnchoredSizeBar
sys.path.append('../')
import python_codes.theme as theme
from python_codes.plot_functions import plot_wind_rose, north_arrow

# Loading figure theme
theme.load_style()

# paths
path_imgs = '../static/images/'
path_savefig = '../Paper/Figures'
path_outputdata = '../static/data/processed_data'

# Loading wind data
Data = np.load(os.path.join(path_outputdata, 'Data_final.npy'), allow_pickle=True).item()
Stations = sorted(Data.keys())

# fig properties
bins = [0.03, 0.15, 0.2, 0.25, 0.3, 0.35, 0.4]
labels = ['Etosha West', 'Huab', 'North Sand Sea', 'South Sand Sea']
coords_stations = np.array([(-19.034111,  15.737194), (-20.874722,  13.642), (-24.125533,  15.049100), (-26.044083,  15.396972)])
scales = [1300, 1100, 1650, 2600]
bbox = dict(facecolor=(1, 1, 1, 0.5), edgecolor=(1, 1, 1, 0))
bbox2 = dict(facecolor=(1, 1, 1, 0.5), edgecolor=(1, 1, 1, 0), pad=0.25)
numbering = [r'\textbf{a}', r'\textbf{b}', r'\textbf{c}', r'\textbf{d}', r'\textbf{e}']
coords_insitu_pix = [(1141, 544), (881, 554), (755, 430), (772, 550)]
props = dict(boxstyle='round', facecolor=(0, 0, 0, 0.3), edgecolor=(0, 0, 0, 0))

# #### Figure
pad = plt.rcParams['figure.constrained_layout.w_pad']
space = plt.rcParams['figure.constrained_layout.wspace']
fig, axarr = plt.subplots(4, 3, figsize=(theme.fig_width, 0.67*theme.fig_height_max),
                          gridspec_kw={'width_ratios': [2, 1, 1], 'left': 1.1*pad, 'top': 1-pad - 0.1,
                          'right': 1-pad, 'bottom': pad, 'hspace': space, 'wspace': space})

for i, ([ax3, ax1, ax2], station) in enumerate(zip(axarr,
                                                   ['Adamax_Station', 'Huab_Station',
                                                    'Deep_Sea_Station', 'South_Namib_Station'])):
    img = np.array(Image.open(os.path.join(path_imgs, station[:-8] + '.png')))
    ax3.imshow(img[:-104, :], zorder=-10)
    ax3.set_xticks([])
    ax3.set_yticks([])
    # labels
    ax3.text(0.015, 0.08, r'\textbf{' + labels[i] + '}', transform=ax3.transAxes,
             ha='left', va='center', bbox=bbox, zorder=-5)
    # scale bars
    backgrnd = Rectangle((0.75, 0), width=0.25, height=0.2, transform=ax3.transAxes,
                         facecolor='w', alpha=0.6, ec=None)
    ax3.add_patch(backgrnd)
    txt = r'$' + str(scales[i]) + r'~\textup{m}$'
    scalebar = AnchoredSizeBar(ax3.transData, 384, txt, 'lower right', color='k',
                               frameon=False, size_vertical=10, label_top=True, sep=1, pad=0.15)
    ax3.add_artist(scalebar)

    # wind roses
    plot_wind_rose(Data[station]['Orientation_era'], Data[station]['U_star_era'], bins,
                   ax1, fig, cmap=theme.cmap_wind, boxprops=props)
    #
    plot_wind_rose(Data[station]['Orientation_insitu'], Data[station]['U_star_insitu'], bins,
                   ax2, fig, cmap=theme.cmap_wind, boxprops=props)
    #
    # stations
    ax3.scatter(coords_insitu_pix[i][0], coords_insitu_pix[i][1], s=25,
                color=theme.color_station_position)
    # north arrow
    rect = plt.Rectangle((0.90, 0.6), width=0.1, height=0.4, color='w', alpha=0.4,
                         transform=ax3.transAxes)
    ax3.add_patch(rect)
    center = np.array([0.95, 0.7])
    length = 0.15
    north_arrow(ax3, center, length, transform=ax3.transAxes,
                color='k', lw=0.05)


pos1 = axarr[0, 1].get_position()
fig.text((pos1.xmin + pos1.xmax)/2, pos1.ymax + space, 'ERA5-Land', ha='center',
         va='center')
pos2 = axarr[0, 2].get_position()
t = fig.text((pos2.xmin + pos2.xmax)/2, pos2.ymax + space, 'Local \n measurements',
             ha='center', va='center')

# #### colorbar
pos3 = axarr[0, 0].get_position()
left, bottom, width, height = [pos3.xmin, pos3.ymax + 2.5*pad, pos3.width, 0.025]
ax_colorbar = fig.add_axes([left, bottom, width, height])

bounds = bins + [bins[-1] + bins[-1] - bins[-2]]
bounds[0] = 0
norm = BoundaryNorm(boundaries=bounds, ncolors=256)
sm = plt.cm.ScalarMappable(cmap='viridis', norm=norm)
cb = fig.colorbar(sm, cax=ax_colorbar, orientation='horizontal', ticks=bounds[::2])
cb.set_label(r'Wind shear velocity, $u_{*}~[\textrm{m}~\textrm{s}^{-1}]$', labelpad=-35)
labels = [item.get_text() for item in cb.ax.get_xticklabels()]


trans = mtransforms.ScaledTranslation(4/72, -4/72, fig.dpi_scale_trans)
for label, ax in zip(numbering, axarr[:, 0].flatten()):
    ax.text(0.0, 1.0, label, transform=ax.transAxes + trans, va='top',
            bbox=dict(alpha=0.5, facecolor='w', edgecolor='none', pad=3.0))

ax_north = axarr[2, 0].inset_axes([1.5, 0.8, 0.1, 0.45])
ax_north.set_axis_off()
center = np.array([0.5, 0.3])
length = 0.4
north_arrow(ax_north, center, length, radius=(4/7)*length, width=1.5*length,
            transform=ax_north.transAxes, color='k', lw=0.05)

plt.savefig(os.path.join(path_savefig, 'Figure2.pdf'), dpi=400)
plt.show()
Total running time of the script: ( 0 minutes 7.365 seconds)