Note
Click here to download the full example code
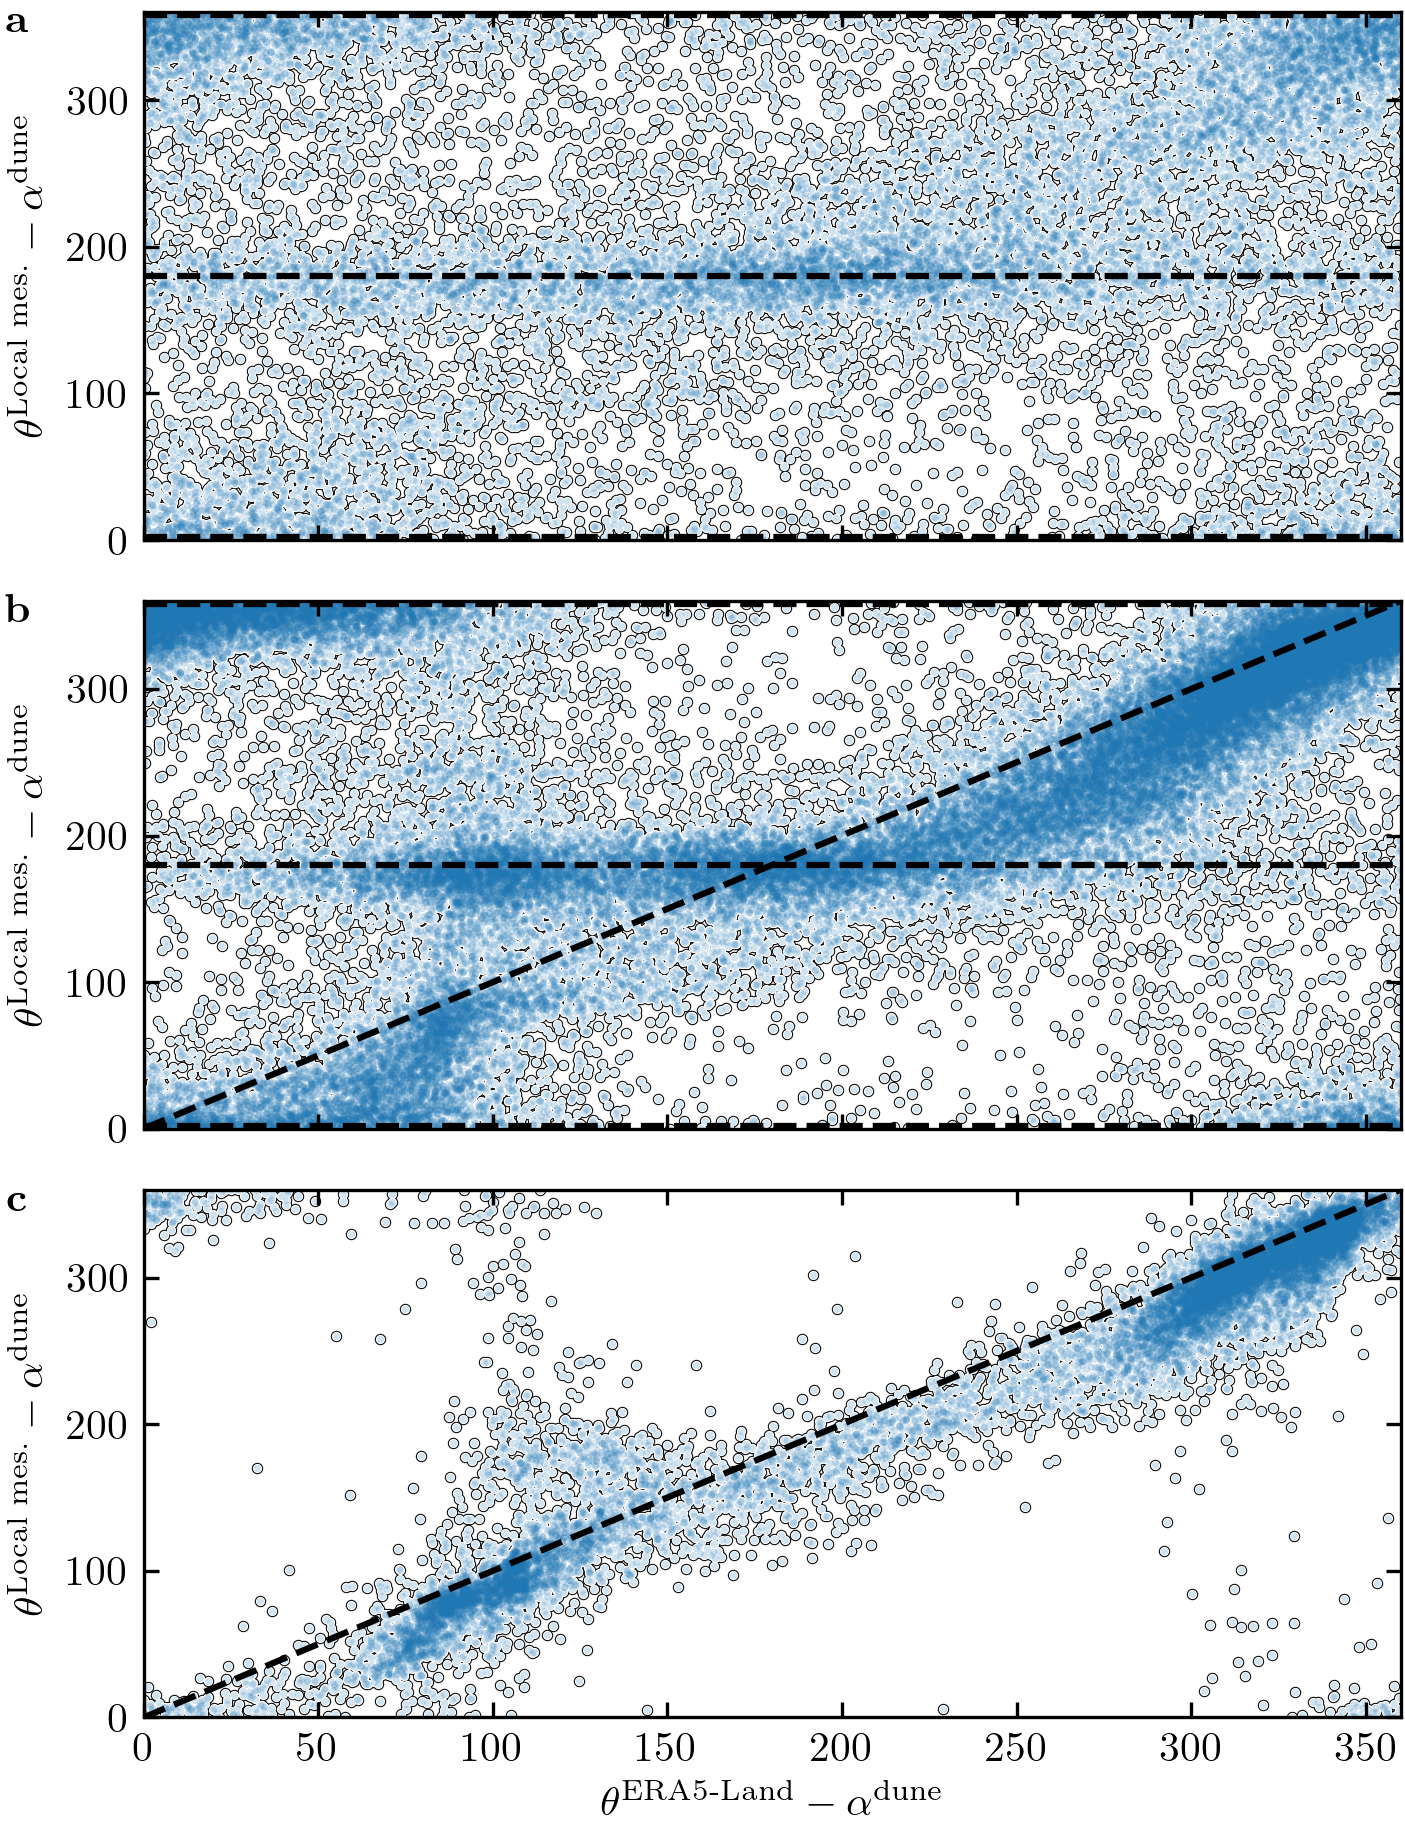
Figure 6 – Online Resource#
import os
import sys
import numpy as np
import matplotlib.pyplot as plt
sys.path.append('../../')
import python_codes.theme as theme
from python_codes.plot_functions import plot_scatter_surrounded


theme.load_style()

# paths
path_savefig = '../../Paper/Figures'
path_outputdata = '../../static/data/processed_data/'

# Loading data
Data = np.load(os.path.join(path_outputdata, 'Data_final.npy'), allow_pickle=True).item()

labels = [r'\textbf{a}', r'\textbf{b}']

# preparing data
Stations = ['South_Namib_Station', 'Deep_Sea_Station']

Dune_orientations = [np.load(os.path.join(path_outputdata, 'Data_DEM.npy'), allow_pickle=True).item()[station]['orientation']
                     for station in Stations]

velocity_thresholds = [0.1, 0.25]

# variables
x1 = np.concatenate([Data[station]['Orientation_era'][Data[station]['U_star_era'] < velocity_thresholds[0]] - Dune_orientations[Stations.index(station)]
                     for station in Stations])
y1 = np.concatenate([Data[station]['Orientation_insitu'][Data[station]['U_star_era'] < velocity_thresholds[0]] - Dune_orientations[Stations.index(station)]
                     for station in Stations])

x2 = np.concatenate([Data[station]['Orientation_era'][(Data[station]['U_star_era'] >= velocity_thresholds[0]) & (Data[station]['U_star_era'] < velocity_thresholds[1])] - Dune_orientations[Stations.index(station)]
                     for station in Stations])
y2 = np.concatenate([Data[station]['Orientation_insitu'][(Data[station]['U_star_era'] >= velocity_thresholds[0]) & (Data[station]['U_star_era'] < velocity_thresholds[1])] - Dune_orientations[Stations.index(station)]
                     for station in Stations])

x3 = np.concatenate([Data[station]['Orientation_era'][(Data[station]['U_star_era'] >= velocity_thresholds[1])] - Dune_orientations[Stations.index(station)]
                     for station in Stations])
y3 = np.concatenate([Data[station]['Orientation_insitu'][(Data[station]['U_star_era'] >= velocity_thresholds[1])] - Dune_orientations[Stations.index(station)]
                     for station in Stations])

X = [x1, x2, x3]
Y = [y1, y2, y3]

# #### Figure
pad_angle = 2
labels = [r'\textbf{a}', r'\textbf{b}', r'\textbf{c}']

fig, axarr = plt.subplots(3, 1, figsize=(theme.fig_width, 1.3*theme.fig_width),
                          constrained_layout=True, sharex=True, sharey=True)


for i, (ax, label, x, y) in enumerate(zip(axarr.flatten(), labels, X, Y)):
    plt.sca(ax)
    plot_scatter_surrounded(x % 360, y % 360, color='tab:blue', alpha=0.2)
    ax.set_ylabel(r'$\theta^{\textup{Local mes.}} - \alpha^{\textup{dune}}$')
    ax.text(-0.1, 0.98, label, ha='center', va='center', transform=ax.transAxes)
    if i in [0, 1]:
        ax.axhline(180, color='k', linestyle='--')
        ax.axhline(0 + pad_angle, color='k', linestyle='--')
        ax.axhline(360 - pad_angle, color='k', linestyle='--')
    if i in [1, 2]:
        ax.plot([0, 360], [0, 360], 'k--')

ax.set_xlim(0, 360)
ax.set_ylim(0, 360)
ax.set_xlabel(r'$\theta^{\textup{ERA5-Land}} - \alpha^{\textup{dune}}$')

plt.savefig(os.path.join(path_savefig, 'Figure6_supp.pdf'), dpi=400)
plt.show()
Total running time of the script: ( 0 minutes 3.042 seconds)