Note
Click here to download the full example code
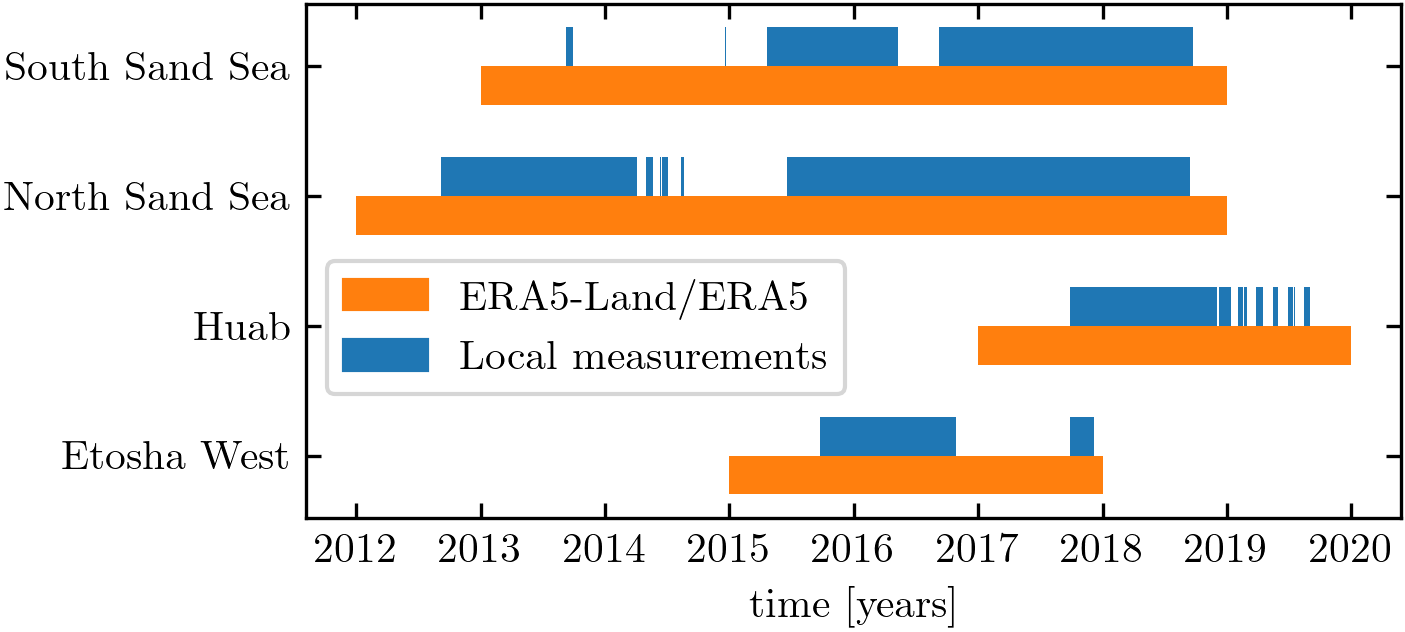
Figure 1 – Online Resource#
import os
import sys
import glob
import numpy as np
import matplotlib.pyplot as plt
import matplotlib.patches as mpatches
sys.path.append('../../')
import python_codes.theme as theme
from datetime import timedelta
#
theme.load_style()


def make_range_broken_barh(time, dt):
    diff = np.diff(time)
    t_diff = np.concatenate((time[1:][diff > dt_threshold], time[:-1][diff > dt_threshold]))
    t_diff = np.insert(t_diff, [0, t_diff.size], [time[0], time[-1]])
    t_diff = np.array(sorted(t_diff))
    return [(tstart, tspan) for tstart, tspan in zip(t_diff[::2], np.diff(t_diff)[::2])]


# paths
path_savefig = '../../Paper/Figures'
path_inputdata = '../../static/data/raw_data/'


Stations = ['Adamax_Station', 'Huab_Station', 'Deep_Sea_Station', 'South_Namib_Station']
labels = ['Etosha West', 'Huab', 'North Sand Sea', 'South Sand Sea']

directory_types = ['ERA5Land', 'measured_wind_data']

colors = [theme.color_Era5Land, theme.color_insitu]

dt_threshold = timedelta(minutes=60)
height_rect = 0.75
height_delta = 1
height_plot = 0
centers = []

fig_width = theme.fig_width
fig_height = 0.45*fig_width
fig = plt.figure(figsize=(fig_width, fig_height), constrained_layout=True)
for station in Stations:
    for i, directory in enumerate(directory_types):
        list_files = glob.glob(os.path.join(path_inputdata, directory, '*.npy'))
        file = [i for i in list_files if station in i][0]
        data = np.load(file, allow_pickle=True).item()
        time = data['time']
        if directory == 'measured_wind_data':
            orientation, velocities = data['direction'], data['velocity']
            mask = (~(np.isnan(velocities) | np.isnan(orientation))) & (velocities > 0)
        else:
            mask = np.ones(time.size).astype(bool)
        xranges = make_range_broken_barh(time[mask], dt_threshold)
        plt.broken_barh(xranges, (height_plot, height_rect), facecolor=colors[i])
        height_plot += height_rect
    centers.append(height_plot - height_rect)
    height_plot += height_delta

plt.xlabel('time [years]')
plt.gca().set_yticks(centers)
plt.gca().set_yticklabels(labels)
ptch_Era5Land = mpatches.Patch(color=colors[0], label='ERA5-Land/ERA5')
ptch_InSitu = mpatches.Patch(color=colors[1], label='Local measurements')
plt.legend(handles=[ptch_Era5Land, ptch_InSitu], loc='lower left', bbox_to_anchor=(0, 0.2))


plt.savefig(os.path.join(path_savefig, 'Figure1_supp.pdf'))
plt.show()
Total running time of the script: ( 0 minutes 0.696 seconds)