Note
Click here to download the full example code
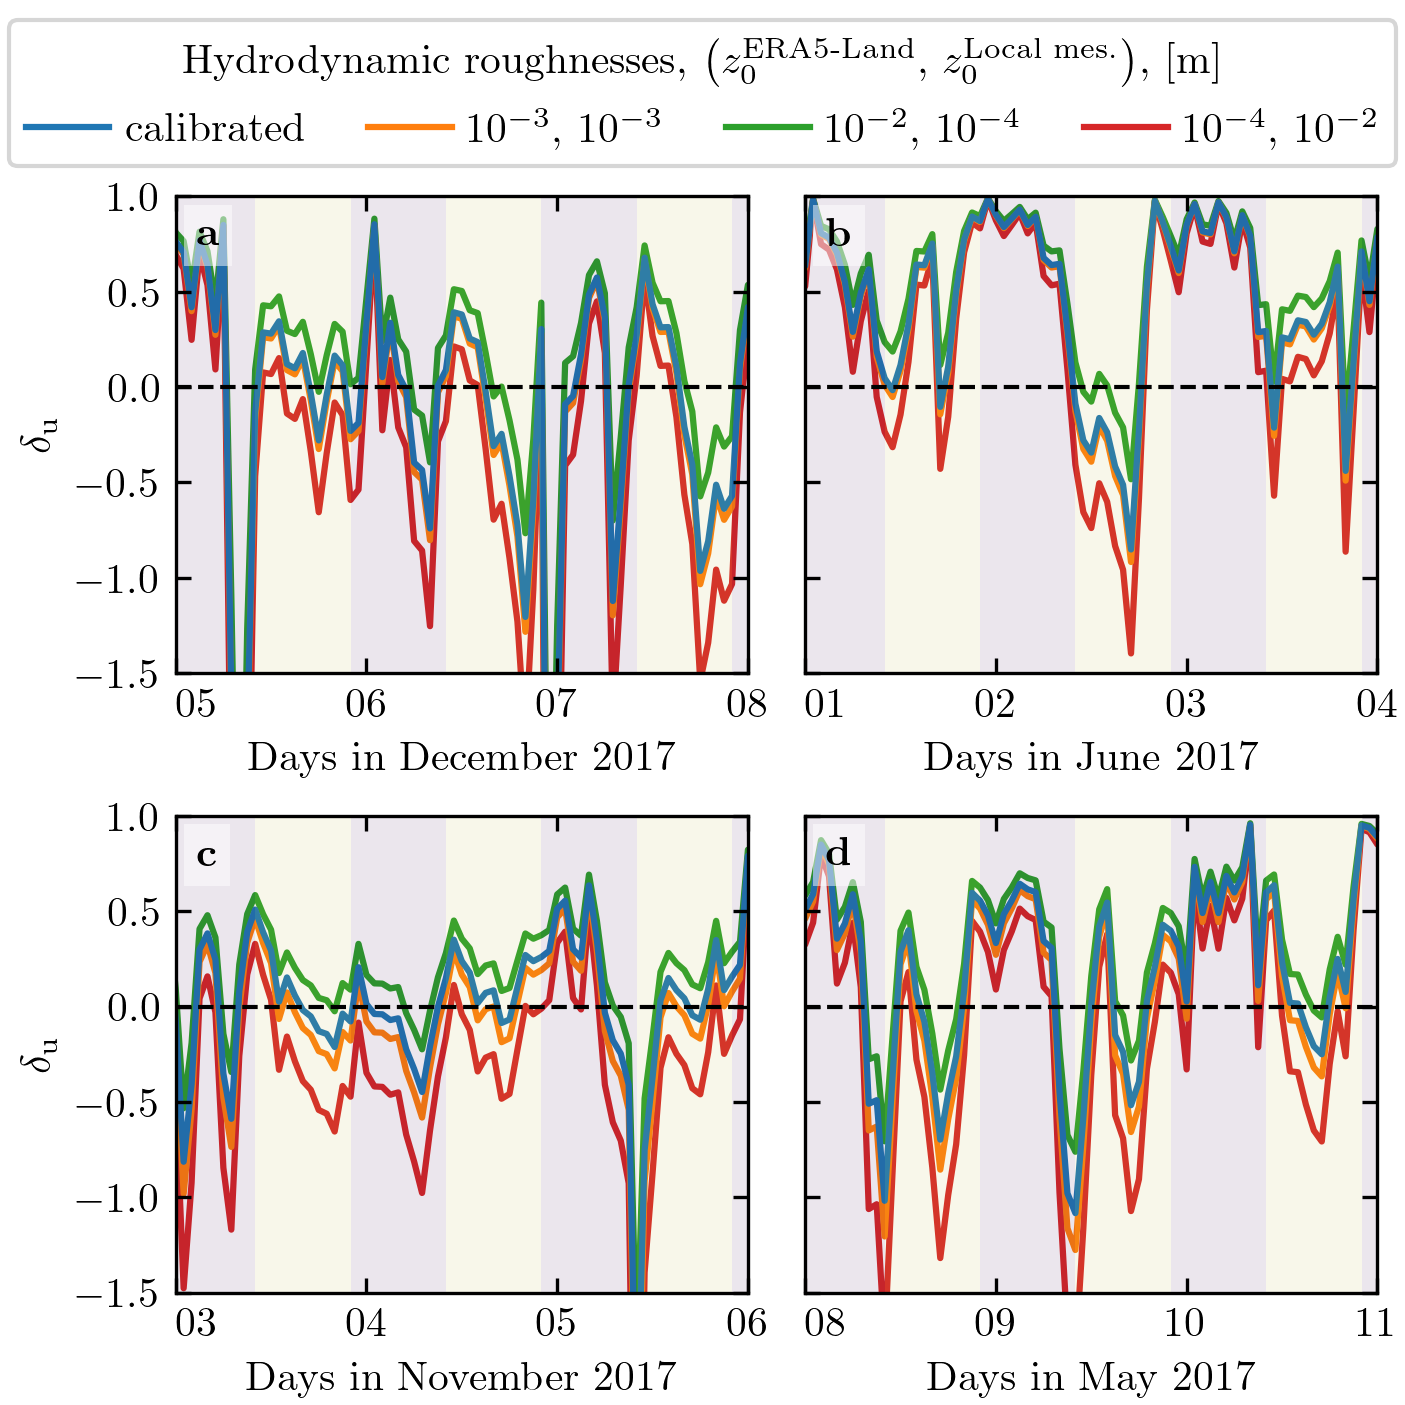
Figure 14 – Online Resource#
import os
import sys
import locale
import calendar
import numpy as np
from datetime import datetime, timedelta
import matplotlib.pyplot as plt
import matplotlib.dates as mdates
from matplotlib.lines import Line2D
import matplotlib.transforms as mtransforms
sys.path.append('../../')
import python_codes.theme as theme
from python_codes.meteo_analysis import mu

locale.setlocale(locale.LC_ALL, 'en_US.utf8')


def tick_formatter(ax, fmt='%d'):
    myFmt = mdates.DateFormatter(fmt)
    ax.xaxis.set_major_formatter(myFmt)
    ticklabels = ax.get_xticklabels()
    ticklabels[0].set_ha('left')


theme.load_style()

# paths
path_savefig = '../../Paper/Figures'
path_outputdata = '../../static/data/processed_data/'

Data = np.load(os.path.join(path_outputdata, 'Data_final.npy'), allow_pickle=True).item()

Stations = ['Deep_Sea_Station', 'Deep_Sea_Station', 'South_Namib_Station', 'South_Namib_Station']
years = [2017, 2017, 2017, 2017]
months = [12, 6, 11, 5]
days = [(5, 8), (1, 4), (3, 6), (8, 11)]
#
z0_values = np.array([(1e-3, 1e-3), (1e-3, 1e-4), (1e-4, 1e-3)])
#
labels = [r'\textbf{a}', r'\textbf{b}', r'\textbf{c}', r'\textbf{d}']
bbox2 = dict(facecolor=(1, 1, 1, 0.7), edgecolor=(1, 1, 1, 0), pad=0.5)
month_calendar = {index: month for index, month in enumerate(calendar.month_name) if month}


# #### Figure
fig, axarr = plt.subplots(2, 2, figsize=(theme.fig_width, theme.fig_width),
                          sharey=True)

for (ax, station, yr, mth, day) in zip(axarr.flatten(), Stations, years,
                                       months, days):
    u_star_era = Data[station]['U_era'][:, None]/mu(Data[station]['z_ERA5LAND'],
                                                    z0_values[:, 0][None, :])
    u_star_station = Data[station]['U_insitu'][:, None]/mu(Data[station]['z_insitu'],
                                                           z0_values[:, 1][None, :])
    #
    u_star_era = np.concatenate([Data[station]['U_star_era'][:, None], u_star_era], axis=1)
    u_star_station = np.concatenate([Data[station]['U_star_insitu'][:, None], u_star_station], axis=1)
    delta_u = (u_star_era - u_star_station)/u_star_era
    #
    tmin = datetime(yr, mth, day[0])
    tmax = datetime(yr, mth, day[1])
    for i, d_u in enumerate(delta_u.T):
        ax.plot(Data[station]['time'], d_u, zorder=-i)
    ax.set_xlim(tmin, tmax)
    ax.set_ylim(-1.5, 1)
    tick_formatter(ax)
    #
    ax.set_xlabel('Days in {} {:d}'.format(month_calendar[tmin.month], tmin.year))
    ax.set_xticks([tmin + timedelta(days=i) for i in range((tmax-tmin).days + 1)])
    ax.axhline(y=0, ls='--', color='k', lw=1)
    #
    tstart = tmin - timedelta(days=1)
    tstart = tstart.replace(hour=10)
    x_night = [tstart + timedelta(days=i) for i in range((tmax-tmin).days + 2)]
    for daylight in x_night:
        a1 = ax.axvspan(daylight, daylight + timedelta(hours=12),
                        facecolor=theme.color_day, alpha=0.1, edgecolor=None, label=theme.Icon_day)
        a2 = ax.axvspan(daylight - timedelta(hours=12), daylight,
                        facecolor=theme.color_night, alpha=0.1, edgecolor=None, label=theme.Icon_night)
    #

for ax in axarr[:, 0]:
    ax.set_ylabel(r'$\delta_{\textup{u}}$')

custom_lines = [Line2D([0], [0], color='tab:blue'),
                Line2D([0], [0], color='tab:orange'),
                Line2D([0], [0], color='tab:green'),
                Line2D([0], [0], color='tab:red')]

fig.legend(custom_lines, ['calibrated',
                          '$10^{-3}$, $10^{-3}$',
                          '$10^{-2}$, $10^{-4}$',
                          '$10^{-4}$, $10^{-2}$',
                          ],
           title=r'Hydrodynamic roughnesses, $\left(z_{0}^{\textup{ERA5-Land}}, \, z_{0}^{\textup{Local mes.}}\right)$, [m]',
           ncol=4,
           handletextpad=0.4, columnspacing=1.5, loc='upper center')

trans = mtransforms.ScaledTranslation(5/72, -5/72, fig.dpi_scale_trans)
for i, (ax, label) in enumerate(zip(axarr[:2, :].flatten(), labels)):
    ax.text(0.0, 1.0, label, transform=ax.transAxes + trans, va='top',
            bbox=dict(alpha=0.5, facecolor='w', edgecolor='none', pad=3.0))

fig.align_labels()
plt.subplots_adjust(top=0.86, right=0.98, bottom=0.08, hspace=0.3, wspace=0.1)
plt.savefig(os.path.join(path_savefig, 'Figure14_supp.pdf'), dpi=400)
plt.show()
Total running time of the script: ( 0 minutes 1.536 seconds)