Note
Click here to download the full example code
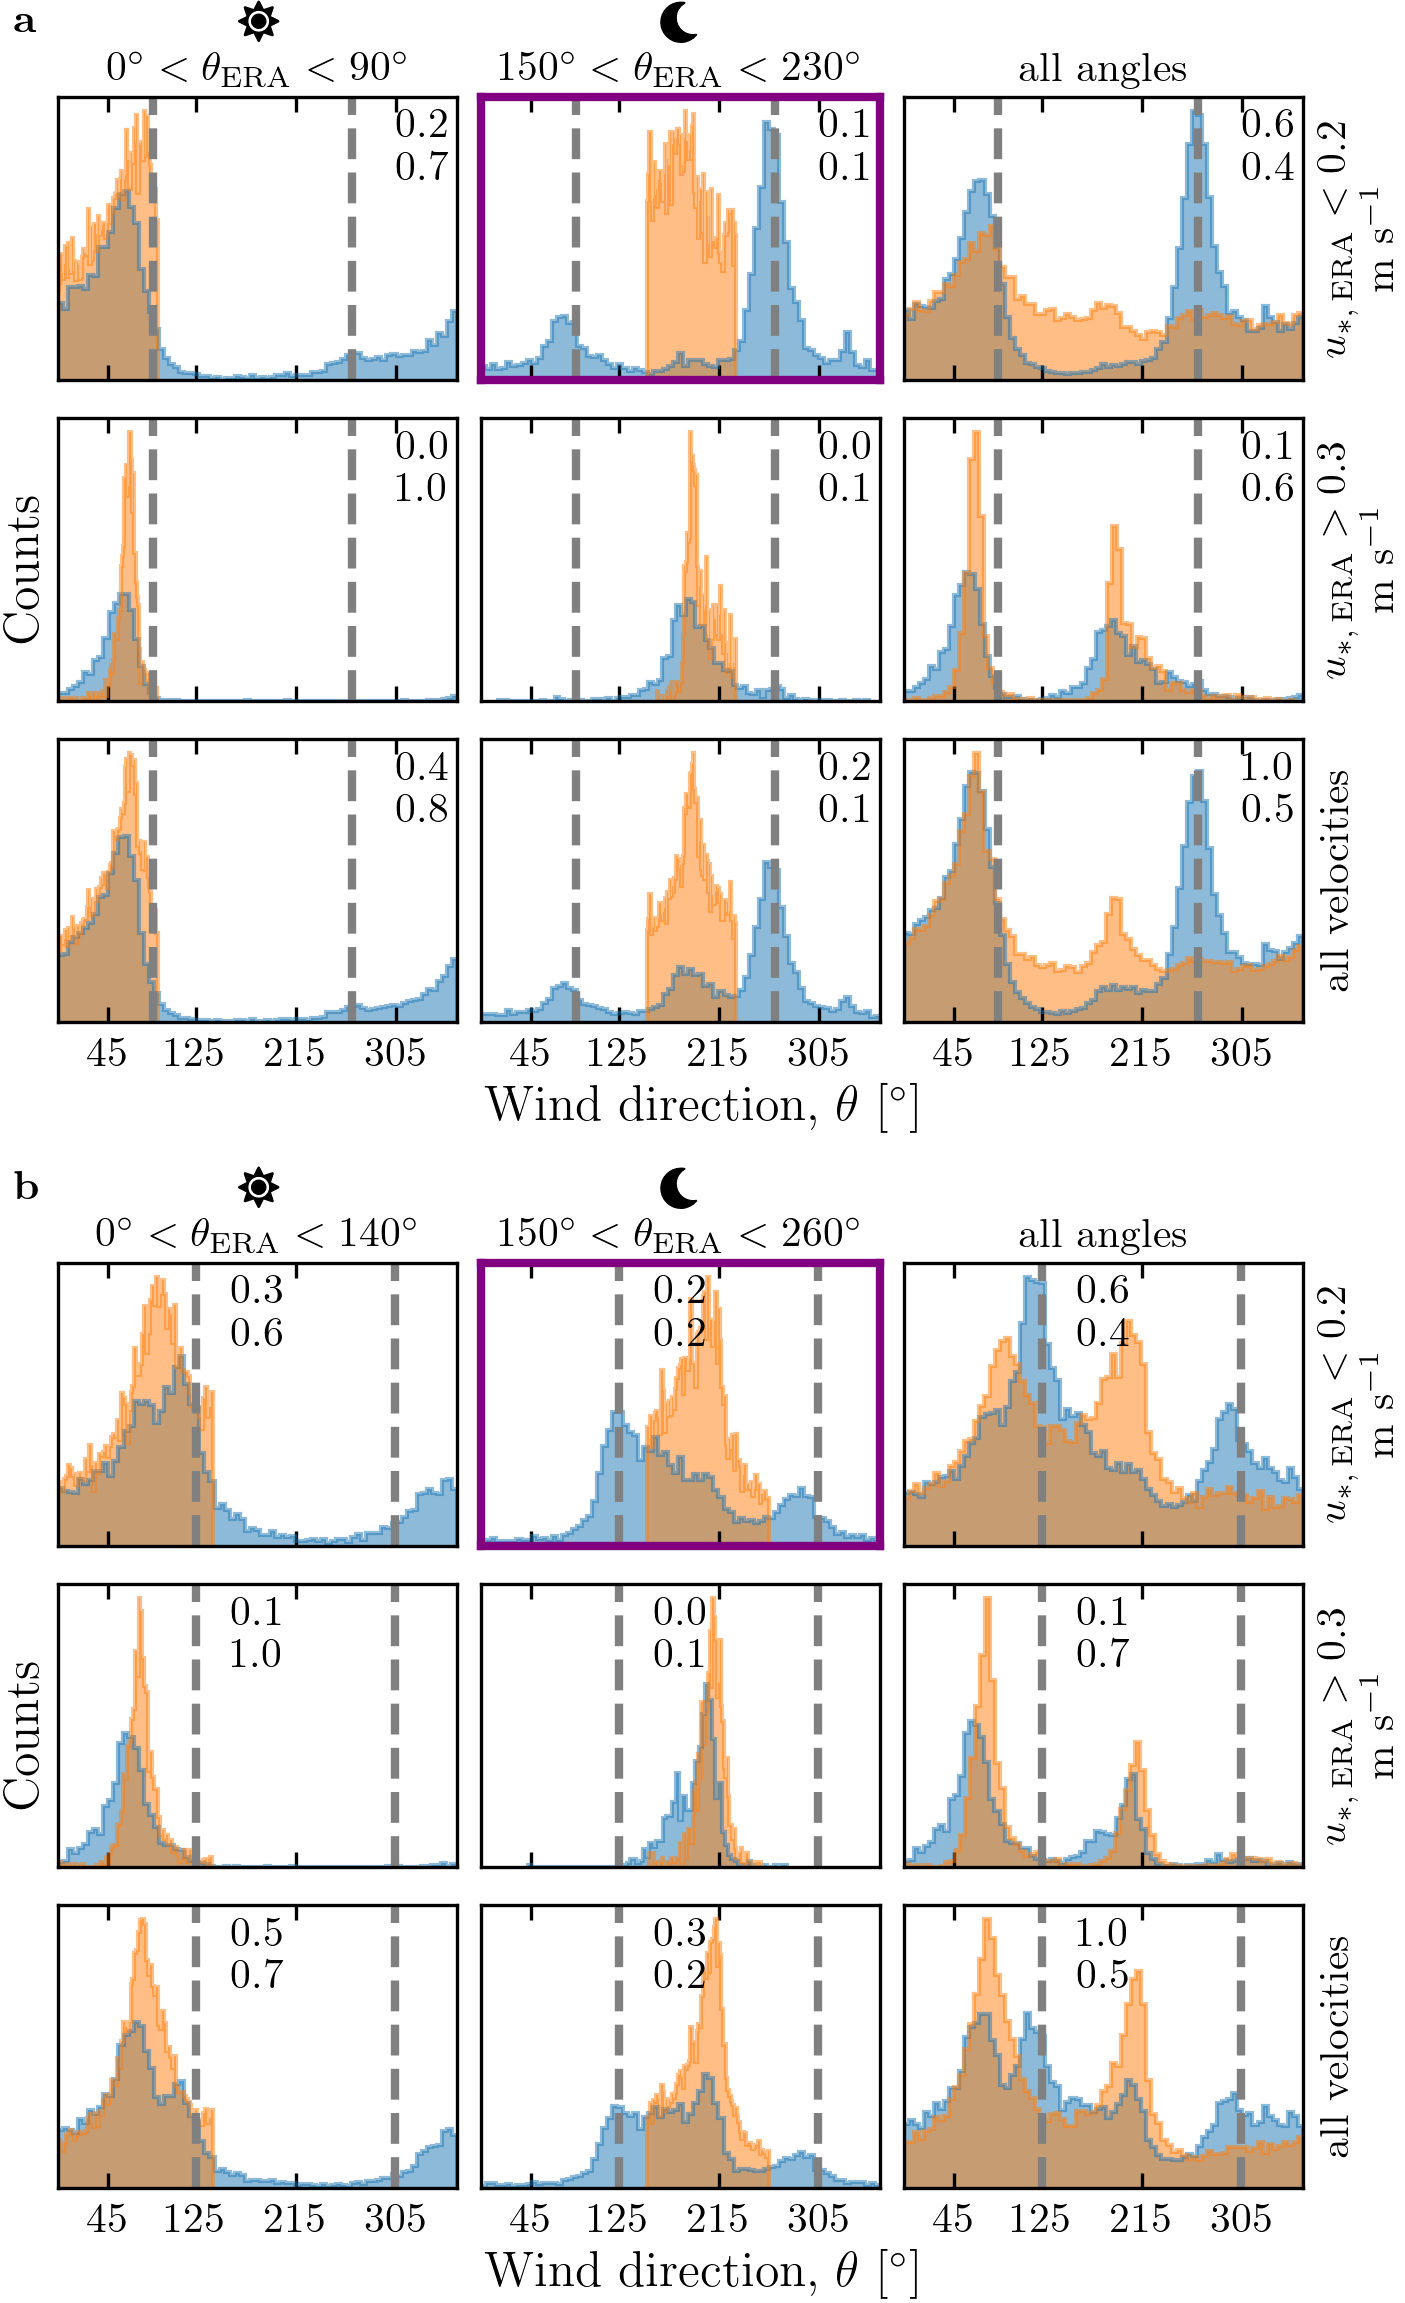
Figure 6#
import os
import sys
import numpy as np
import matplotlib.pyplot as plt
sys.path.append('../')
import python_codes.theme as theme
from python_codes.plot_functions import make_nice_histogram

# Loading figure theme
theme.load_style()

# paths
path_imgs = '../static/images/'
path_savefig = '../Paper/Figures'
path_outputdata = '../static/data/processed_data'

# Loading wind data
Data = np.load(os.path.join(path_outputdata, 'Data_final.npy'), allow_pickle=True).item()
Stations = sorted(Data.keys())

# Figure properties
Stations = ['Deep_Sea_Station', 'South_Namib_Station']
#
theta_bins_list = [[[0, 90], [150, 230]], [[0, 140], [150, 260]]]
velocity_bins_list = [[[0.05, 0.2], [0.3, 10]], [[0.05, 0.2], [0.3, 10]]]
Data_pattern = np.load(os.path.join(path_outputdata, 'Data_DEM.npy'), allow_pickle=True).item()
icon = [r'\faSun', r'\faMoon']
labels = [r'\textbf{a}', r'\textbf{b}']

color_ax = 'purple'

# ################ Figure
fig = plt.figure(constrained_layout=True, figsize=(theme.fig_width,
                                                   theme.fig_height_max))
subfigs = fig.subfigures(2, 1, hspace=0.025)
#
for (station, subfig, theta_bins,
     velocity_bins, label) in zip(Stations, subfigs, theta_bins_list,
                                  velocity_bins_list, labels):
    #
    axarr = subfig.subplots(3, 3, sharex=True)
    #
    for i in range(3):  # Loop over velocites
        if i < 2:
            mask_U = (Data[station]['U_star_era'] >= velocity_bins[i][0]) & (Data[station]['U_star_era'] <= velocity_bins[i][1])
            label_u = r'$u_{*, \, \textup{ERA}} < ' + str(velocity_bins[i][1]) + '$ \n m~s$^{-1}$' if i == 0 else r'$u_{*, \, \textup{ERA}} > ' + str(velocity_bins[i][0]) + '$ \n m~s$^{-1}$'
        else:
            mask_U = (Data[station]['U_star_era'] < 10)  # take all velocities
            label_u = 'all velocities'
        axarr[i, -1].set_ylabel(label_u)
        axarr[i, -1].yaxis.set_label_position("right")
        for j in range(3):  # loop over angles
            if j < 2:
                mask_theta = (Data[station]['Orientation_era'] >= theta_bins[j][0]) & (Data[station]['Orientation_era'] <= theta_bins[j][1])
                label_theta = icon[j] + '\n' + r'${:d}^\circ < \theta_{{\textup{{ERA}}}} < {:d}^\circ$'.format(theta_bins[j][0], theta_bins[j][-1])
            else:
                mask_theta = Data[station]['Orientation_era'] < 400  # take all orientations
                label_theta = 'all angles'
            make_nice_histogram(Data[station]['Orientation_insitu'][mask_theta & mask_U], 80, axarr[i, j], alpha=0.5, color=theme.color_insitu)
            make_nice_histogram(Data[station]['Orientation_era'][mask_theta & mask_U], 80, axarr[i, j], alpha=0.5, color=theme.color_Era5Land)
            #
            axarr[i, j].axvline(Data_pattern[station]['orientation'], color=theme.color_dune_orientation, ls='--', lw=2)
            axarr[i, j].axvline((Data_pattern[station]['orientation'] + 180) % 360, color=theme.color_dune_orientation, ls='--', lw=2)
            #
            perc = (mask_theta & mask_U).sum()/mask_theta.size
            hours = np.array([t.hour for t in Data[station]['time'][(mask_theta & mask_U)]])
            mask_day = (hours > 10) & (hours <= 10 + 12)
            perc_day = mask_day.sum()/(mask_theta & mask_U).sum()
            #
            x_test = 0.98 if station == 'Deep_Sea_Station' else 0.5
            ha = 'right'if station == 'Deep_Sea_Station' else 'center'
            axarr[i, j].text(x_test, 0.96, '{:.1f} \n {:.1f}'.format(perc, perc_day), ha=ha, va='top', transform=axarr[i, j].transAxes)
            #
            if i == 0:
                axarr[i, j].set_xlabel(label_theta)
                axarr[i, j].xaxis.set_label_position("top")
                if j == 1:
                    for axis in ['top', 'bottom', 'left', 'right']:
                        axarr[i, j].spines[axis].set_color(color_ax)
                        axarr[i, j].spines[axis].set_linewidth(2)

    plt.xlim(0, 360)
    plt.xticks([45, 125, 215, 305])
    for ax in axarr.flatten():
        ax.set_yticks([])
    subfig.supxlabel(r'Wind direction, $\theta~[^\circ]$')
    subfig.supylabel('Counts')
    subfig.text(0.01, 0.98, label, ha='left', va='center', transform=subfig.transSubfigure)

plt.savefig(os.path.join(path_savefig, 'Figure6.pdf'))
plt.show()
Total running time of the script: ( 0 minutes 2.183 seconds)