Note
Click here to download the full example code
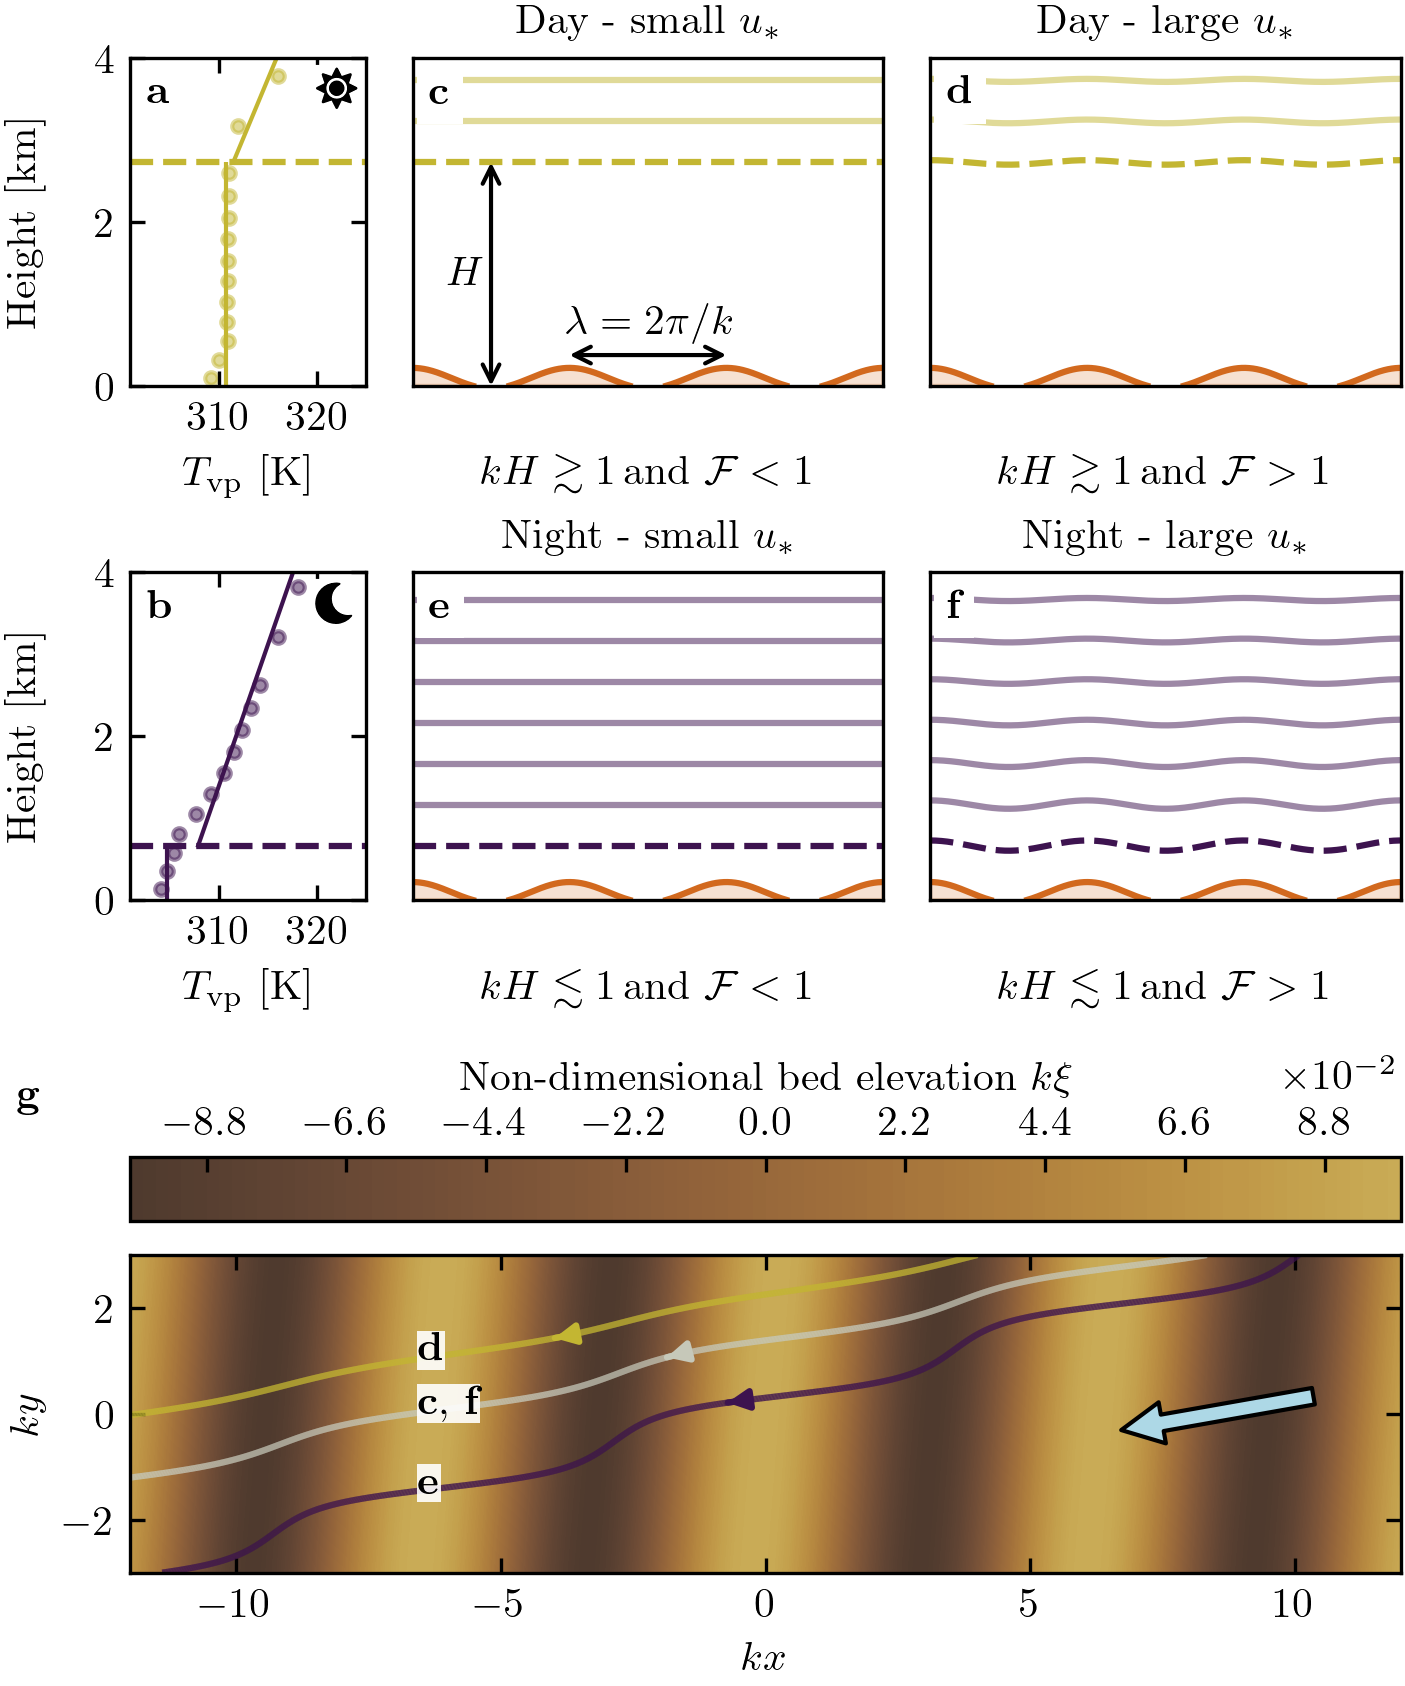
Figure 7#
import os
import sys
import numpy as np
import matplotlib.pyplot as plt
import matplotlib.transforms as mtransforms
from matplotlib.patches import FancyArrowPatch
sys.path.append('../')
import python_codes.theme as theme
from python_codes.general import cosd, sind
from python_codes.linear_theory import Cisaillement_basal_rotated_wind, coeffA0, coeffB0


def perturb(x, z, amp, lamb, shift):
    return np.cos(2*np.pi*x/lamb)*amp*np.exp(-z/lamb) + shift


def plot_vertical_profile(ax, height, Virtual_potential_temperature, grad_free_atm, theta_free_atm, blh, theta_ground, Hmax_fit, color='tab:blue', label=None, alpha_pt=1):
    Hfit = np.linspace(blh, Hmax_fit, 100)
    #
    line = ax.vlines(theta_ground, 0, blh/1e3, color=color, label=label, zorder=-3, lw=1)
    ax.axhline(blh/1e3, color=color, ls='--')
    ax.plot(np.poly1d([grad_free_atm, theta_free_atm])(Hfit), Hfit/1e3, color=line.get_color(), zorder=-2, lw=1)
    ax.plot(Virtual_potential_temperature, height/1e3, '.', color=line.get_color(), zorder=-1, alpha=alpha_pt)
    # ax.scatter(theta_ground, blh/1e3, s=30, facecolors=line.get_color(), edgecolors='k', linewidth=2, zorder=0)


def plot_streamlines(ax, z_pos, x, amp, lamb, **kwargs):
    for z in z_pos:
        ax.plot(x, perturb(x, z, amp, lamb, z), **kwargs)


def topo(x, y, alpha, k, xi):
    return xi*np.cos(k*(cosd(alpha)*x + sind(alpha)*y))


# Loading figure theme
theme.load_style()

# paths
path_imgs = '../static/images/'
path_savefig = '../Paper/Figures'
path_outputdata = '../static/data/processed_data'

# ##### Loading meteo data
Data = np.load(os.path.join(path_outputdata, 'Data_final.npy'), allow_pickle=True).item()
Stations = ['South_Namib_Station', 'Deep_Sea_Station']

# #### figure parameters
# ## sketch parameters
flow_color = 'powderblue'
color_dune = '#D2691E'
alpha_dune = 0.2
#
lambda_dune = 2.5
mult = 1
hdune = 0.05*lambda_dune*mult
lw_capping_layer = 3
#
n_dunes = 3
xlims = [0, n_dunes*lambda_dune]
x = np.linspace(xlims[0], xlims[1], 500)
dunes = perturb(x, 0, hdune, lambda_dune, 0.75*hdune)
dunes[dunes < 0] = np.nan
#
xmax = x.max()
pad_x = 0.05*xmax
dz = lambda_dune/5

# ## vertical profiles parameters
station = 'Deep_Sea_Station'
time_steps = [18206, 18206, 9354, 9354]
colors = [theme.color_day, theme.color_day, theme.color_night, theme.color_night]
Icons = [theme.Icon_day, theme.Icon_night]
Hmax_fit = 10000  # [m]

zmax = 0.4*Hmax_fit/1e3

# ## labels
titles = [r'Day - small $u_{*}$', 'Day - large $u_{*}$', 'Night - small $u_{*}$', 'Night - large $u_{*}$']
labels = [r'\textbf{a}', r'\textbf{b}', r'\textbf{c}', r'\textbf{d}', r'\textbf{e}', r'\textbf{f}', r'\textbf{g}']
xlabels = [r'$k H \gtrsim 1 \, \textup{and} \, \, \mathcal{F} < 1$',
           r'$k H \gtrsim 1 \, \textup{and} \, \, \mathcal{F} > 1$',
           r'$k H \lesssim 1 \, \textup{and} \, \, \mathcal{F} < 1$',
           r'$k H \lesssim 1 \, \textup{and} \, \, \mathcal{F} > 1$']

props = dict(boxstyle='square, pad=0.1', color='white', alpha=1)

hours = np.array([i.hour for i in Data[station]['time']])
mask = ~((hours > 10) & (hours < 22)) & ~np.isnan(Data[station]['Froude']) & (Data[station]['Boundary layer height'] > 500) & (Data[station]['Boundary layer height'] < 1000) & (Data[station]['delta_theta'] > 2.5) & (Data[station]['delta_theta'] < 3.5) & (Data[station]['theta_ground'] > 305) & (Data[station]['theta_ground'] < 310)
mask = ((hours > 10) & (hours < 22)) & ~np.isnan(Data[station]['Froude']) & (Data[station]['Boundary layer height'] > 2400) & (Data[station]['Boundary layer height'] < 2800) & (Data[station]['theta_ground'] > 310) & (Data[station]['theta_ground'] < 314)
idx = np.arange(Data[station]['Froude'].size)

# #### Figure
fig, axrr = plt.subplots(4, 3, figsize=(theme.fig_width, 1.2*theme.fig_width),
                         constrained_layout=True,
                         gridspec_kw={'width_ratios': [0.5, 1, 1], 'height_ratios': [1, 1, 0.005, 1.3]})

for ax in axrr[2, :]:
    ax.set_axis_off()

# #### Plot vertical profiles
for i, (t, ax) in enumerate(zip(time_steps[::2], axrr[:2, 0].flatten())):
    ax.set_title(r' ')
    ax.text(0.96, 0.96, Icons[i], ha='right', va='top', transform=ax.transAxes, bbox=props)
    ax.set_ylim(0, top=zmax)
    ax.set_xlim(301, 325)
    ax.set_ylabel('Height [km]')
    ax.set_xlabel(r'$T_{\textup{vp}}$ [K]')
    #
    plot_vertical_profile(ax, Data[station]['height'][:, t], Data[station]['Virtual_potential_temperature'][:, t],
                          Data[station]['gradient_free_atm'][t], Data[station]['theta_free_atm'][t],
                          Data[station]['Boundary layer height'][t], Data[station]['theta_ground'][t], Hmax_fit,
                          color=colors[2*i], alpha_pt=0.5)

# #### Sketches
amplitudes = [0, 1.3, 0, 1.3]
for i, (t, ax) in enumerate(zip(time_steps, axrr[:2, 1:].flatten())):
    ax.set_xticks([])
    ax.set_yticks([])
    ax.set_ylim(0, top=zmax)
    ax.set_xlim(xlims)
    # ax.set_aspect('equal')
    # dunes
    a, = ax.plot(x, dunes, color=color_dune)
    ax.fill_between(x, dunes, color=a.get_color(), alpha=alpha_dune)
    # FA
    amp = amplitudes[i]*hdune
    z_pos = np.arange(Data[station]['Boundary layer height'][t]/1e3, zmax, dz)
    plot_streamlines(ax, z_pos[1:], x, 0.5*amp, lambda_dune, color=colors[i], alpha=0.5)
    # capping layer
    z_pos = np.arange(Data[station]['Boundary layer height'][t]/1e3, zmax, dz)
    plot_streamlines(ax, z_pos[0:1], x, 0.5*amp, lambda_dune, color=colors[i], ls='--')
    #
    ax.set_xlabel(xlabels[i])
    ax.set_title(titles[i])

axrr[0, 1].annotate('', xy=[lambda_dune, 3*hdune], xytext=[2*lambda_dune, 3*hdune], transform=axrr[0, 1].transData, arrowprops=dict(arrowstyle="<->", color='k', shrinkA=0, shrinkB=0))
axrr[0, 1].text(1.5*lambda_dune + 0.03, 3*hdune + 0.4, r'$\lambda=2\pi/k$', ha='center', va='center')
hflow = Data[station]['Boundary layer height'][time_steps[0]]/1e3
axrr[0, 1].annotate('', xy=[lambda_dune/2, 0], xytext=[lambda_dune/2, hflow], transform=axrr[0, 1].transData, arrowprops=dict(arrowstyle="<->", color='k', shrinkA=0, shrinkB=0))
axrr[0, 1].text(lambda_dune/2 - 0.15, hflow/2, r'$H$', ha='right', va='center')

# #### Horizontal view
# merging axes
gs = axrr[0, 0].get_gridspec()
for ax in axrr[-1, :]:
    ax.remove()
ax = fig.add_subplot(gs[-1, :])

# ## streamline parameters
station = Stations[1]
Data_DEM = np.load(os.path.join(path_outputdata, 'Data_DEM.npy'), allow_pickle=True).item()[station]

#
alpha = Data_DEM['orientation'] - 90  # dune orientation, degrees
k = 1  # non dimensional wavenumber
AR = 0.1
skip = (slice(None, None, 50), slice(None, None, 50))
eta_0 = 2.5e-6
bbox = dict(facecolor=(1, 1, 1, 0.9), edgecolor=(1, 1, 1, 0), pad=0.2)

# horizontal space
x = np.linspace(-12, 12, 1000)
y = np.linspace(-3, 3, 1000)
X, Y = np.meshgrid(x, y)

Theta_list = [190, 190, 190]
A0_list = [coeffA0(eta_0), 6, 8]
B0_list = [coeffB0(eta_0), 2, 2.7]
colors = [theme.color_day, '#c6c8b9', theme.color_night]

cnt = ax.contourf(x, y, topo(X, Y, alpha, k, AR), levels=100, vmin=-(AR + 0.06),
                  vmax=AR + 0.02, zorder=-5, cmap=theme.cmap_topo)
for c in cnt.collections:
    c.set_edgecolor("face")
    c.set_rasterized(True)

for i, (theta, A0, B0, color) in enumerate(zip(Theta_list, A0_list, B0_list, colors)):
    TAU = Cisaillement_basal_rotated_wind(X, Y, alpha, A0, B0, AR, theta)
    ustar = np.sqrt(np.linalg.norm(np.array(TAU), axis=0))
    theta = np.arctan2(TAU[1], TAU[0])
    # ax.quiver(X[skip], Y[skip], TAU[0][skip], TAU[1][skip], color='grey')
    strm = ax.streamplot(X, Y, ustar*np.cos(theta), ustar*np.sin(theta), density=50, start_points=[[4, 3-0.75*i]], color=color)

tail = np.array([10.5, 0.36])
length = 4
head = tail + np.array([cosd(Theta_list[0]), sind(Theta_list[0])])*length

arrow = FancyArrowPatch(tail, head, mutation_scale=20, facecolor='lightblue')
ax.add_patch(arrow)

ax.text(-6.57, 1, ' ' + labels[3] + ' ', bbox=bbox)
ax.text(-6.57, 0, ' ' + labels[2] + ', ' + labels[5] + ' ', bbox=bbox)
ax.text(-6.57, -1.5, ' ' + labels[4] + ' ', bbox=bbox)

cb = fig.colorbar(cnt, label=r'Non-dimensional bed elevation $k \xi$', ax=ax, location='top', pad=0.08)
cb.formatter.set_powerlimits((0, 0))
cb.update_ticks()
ax.set_xlabel('$kx$')
ax.set_ylabel('$ky$')
ax.set_aspect('equal')
fig.text(-0.07, 1.5, labels[-1], ha='right', va='center', transform=ax.transAxes)

ax_list = [axrr[0, 0], axrr[1, 0], axrr[0, 1], axrr[0, 2], axrr[1, 1], axrr[1, 2]]
trans = mtransforms.ScaledTranslation(4/72, -4/72, fig.dpi_scale_trans)
for label, ax in zip(labels, ax_list):
    ax.text(0.0, 1.0, label, transform=ax.transAxes + trans, va='top',
            bbox=dict(facecolor='w', edgecolor='none', pad=3.0))

fig.align_labels()
plt.savefig(os.path.join(path_savefig, 'Figure7.pdf'))
plt.show()
Total running time of the script: ( 0 minutes 5.705 seconds)